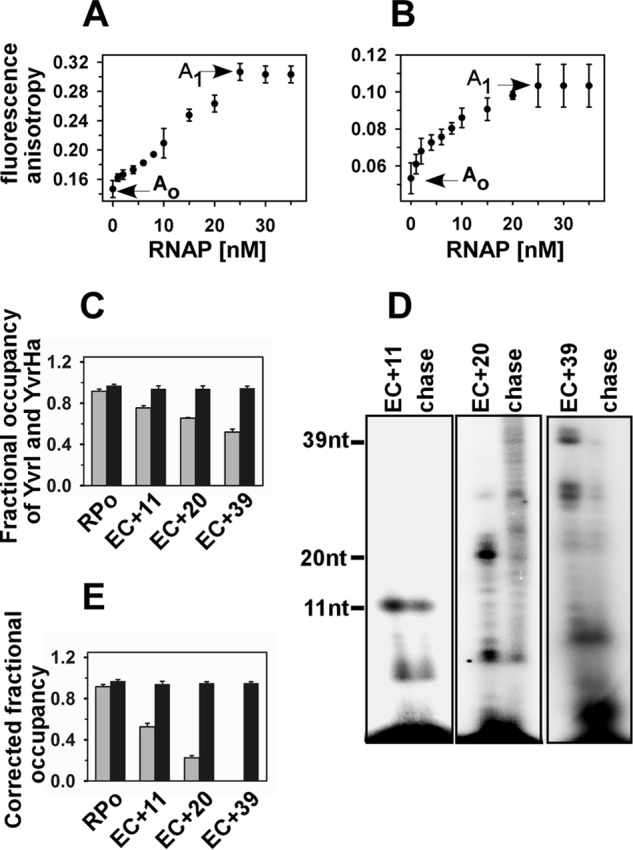
FIGURE 4.

Fractional occupancy of YvrI and YvrHa of B. subtilis in EC:fluorescence anisotropy assay. A, fluorescence anisotropy values of 20 nm TMR-labeled YvrI (and 20 nm unlabeled YvrHa) upon titration with B. subtilis RNAP core. Ao (0.15) and A1 (0.3) were the values of free and fully bound YvrI, respectively. B, fluorescence anisotropy values of 20 nm TMR-labeled YvrHa (and 20 nm unlabeled YvrI) upon titration with B. subtilis RNAP core. Ao (0.051) and A1 (0.104) were the values of free and fully bound YvrHa, respectively. C, open complexes were formed by incubating 50 nm B. subtilis RNAP core, 20 nm each of labeled YvrI and YvrHa with 50 nm PoxdC promoter in solution at 37 ºC. Stalled elongation complexes are generated by adding 500 μm each of ApG, heparin, and other NTPs at +11 (without CTP), +20 (without UTP), and +39 (without UTP). The mean anisotropy values of RPo, EC+11, EC+20, and EC+39 were 0.297, 0.26, 0.24, and 0.22, respectively, for YvrI; 0.104, 0.102, 0.1, and 0.1, respectively, for YvrHa. The fractional occupancies of YvrI and YvrHa were determined by estimating the amount of bound proteins in RPo and EC from the anisotropy values of the protein in the respective complexes. Gray bar, YvrI; black bar, YvrHa. D, representative data for in vitro transcription assay in solution. Stalled elongation complexes EC+11, EC+20, and EC+39 were generated using 32P-labeled NTP; chase, all four NTP were added to EC to produce runoff products. The samples were run on 12% urea PAGE and scanned on a phosphorimager. E, fractional occupancies of YvrI and YvrHa after correction for the subpopulations that are competent to form EC. Data were average of six replicates. Gray bar, YvrI; black bar, YvrHa.
