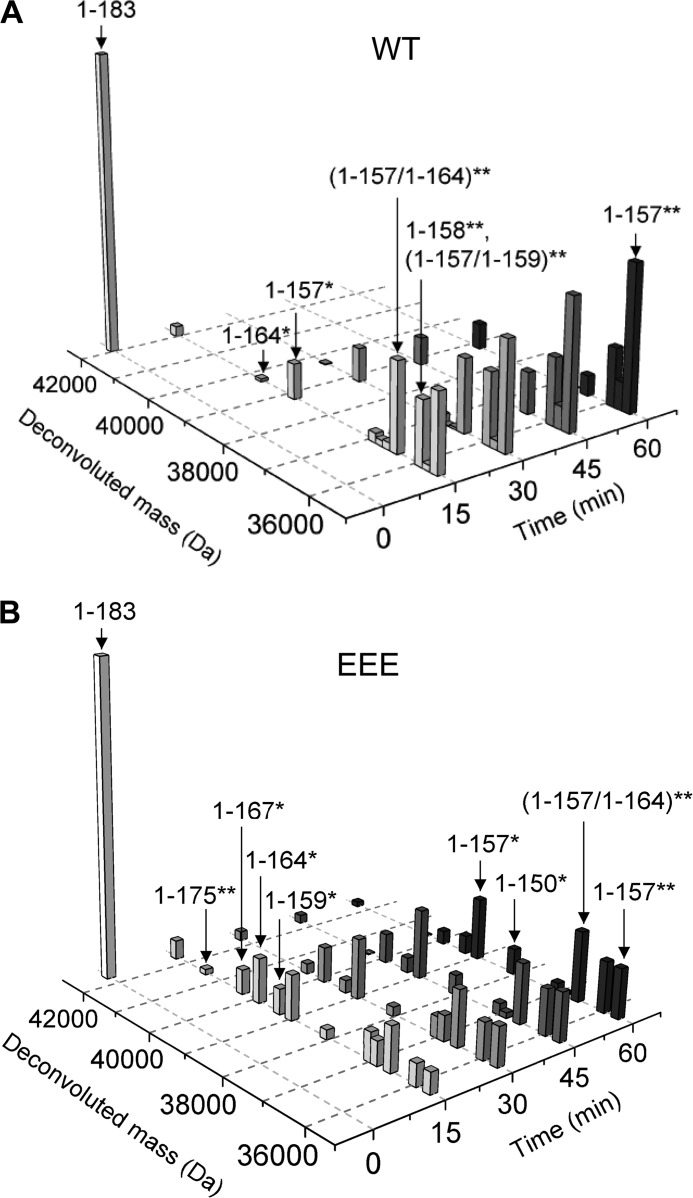
FIGURE 3.
LC-MS shows a difference in cleavage pattern between Cp183-WT and Cp183-EEE capsids. A and B, LC-MS of trypsin cleavage of 10 μm Cp183-WT (A) and Cp83-EEE (B) capsids with 0.12 μm trypsin. Panels show the normalized deconvoluted masses in Da before and after digestion of capsids for 15, 30, 45, and 60 min. The y axis denotes normalized intensity of the deconvoluted mass. A single asterisk indicates cleavage of a monomer within a dimer, while a double asterisk indicates cleavage of both monomers within a dimer. The numbers in brackets denote the site N-terminal of trypsin cleavage.

