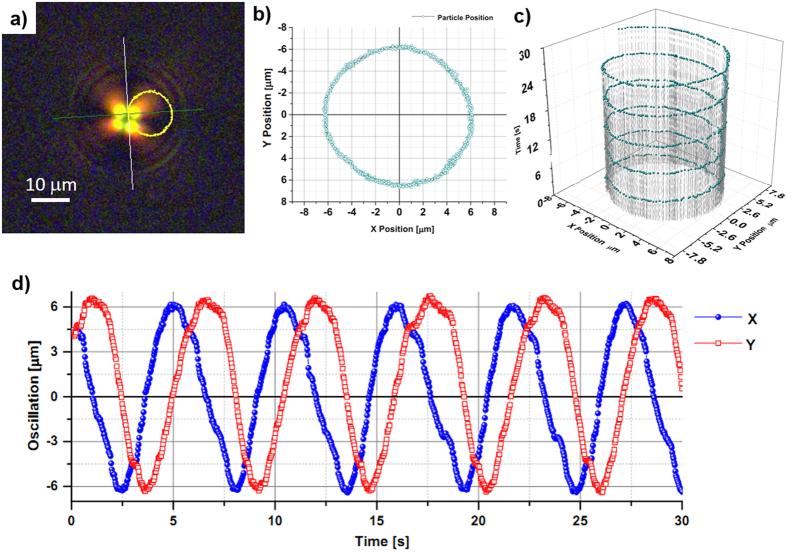
Figure 5. Orbital trajectory analysis for 1000 frames on 30 seconds of video 2.
(a) Correspond to a capture from the supplementary video 2 after perform the trajectory analysis of the centroid of the particle, the calculated orbit is indicated by the yellow ring, (b) show the graphic of the orbit with respect to the beam axis on the captured images by the CCD camera, the calculated diameter of the orbit was approximately 13 μm (c) corresponds to the 3D graphic trajectory along the time of 30 s and (d) indicates the oscillation during the time for both coordinates x and y.

