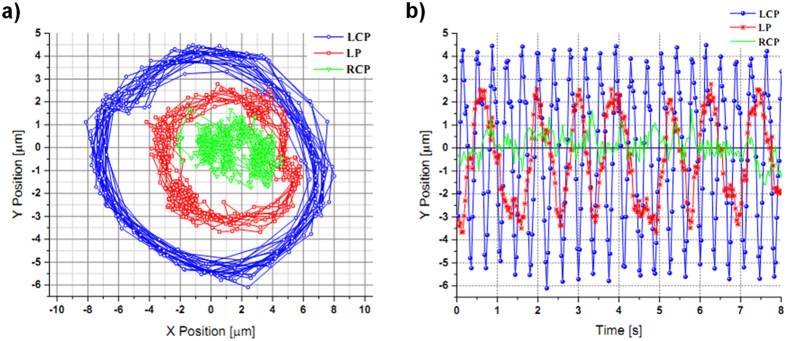
Figure 6. Analysis of orbital trajectories for each polarization state.
On the graphic are plotted the experimental data obtained when the polarization state passes from LCP to LP and then to RCP. The data are obtained from the supplementary video 3. In (a) are reported trajectories of the particle and in (b) the projection of the position along y-axis.

