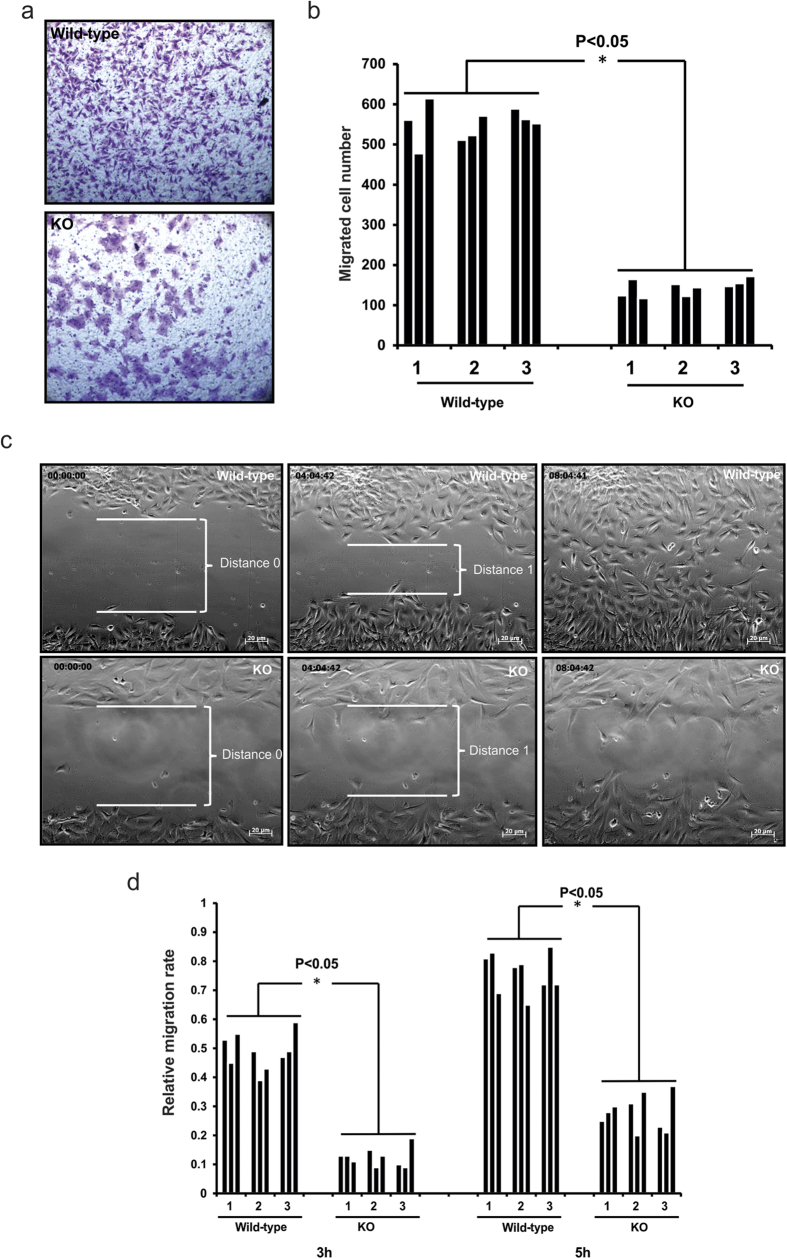
Figure 2. Reduced migration in the Spag6-deficient (KO) MEFs.
(a) Transwell chamber assay. Representative images of the migrated cells on the membranes. Equal numbers of wild-type (upper panel) and Spag6-deficient MEFs (lower panel) were loaded, six hours after migration, the membranes were stained with crystal violet. (b) The number of migrated cells was counted, and the migrated cell/total cell ratio was calculated. There was a significant reduction in the Spag6-deficient MEFs (p < 0.05). Three wild-type and three Spag6-deficient cell lines were studied, and each cell line was analyzed three times. (c) Wound-healing assay. Representative images after scratch. Upper panel: wild-type MEFs; lower panel: Spag6-deficient MEFs. Notice that eight hours after scratch, wild-type MEFs filled the scratch space. However, a significant scratch space was still present in the Spag6-deficient MEFs. (d) Relative migration rate of the MEFs. The migration distance was measured three and five hours from time 0, and the relative migration rate was calculated as described in the Materials and Methods section. The rate was significantly higher in the wild-type MEFs. *p < 0.05.

