
Figure 9. Expression profiles of miRNA.
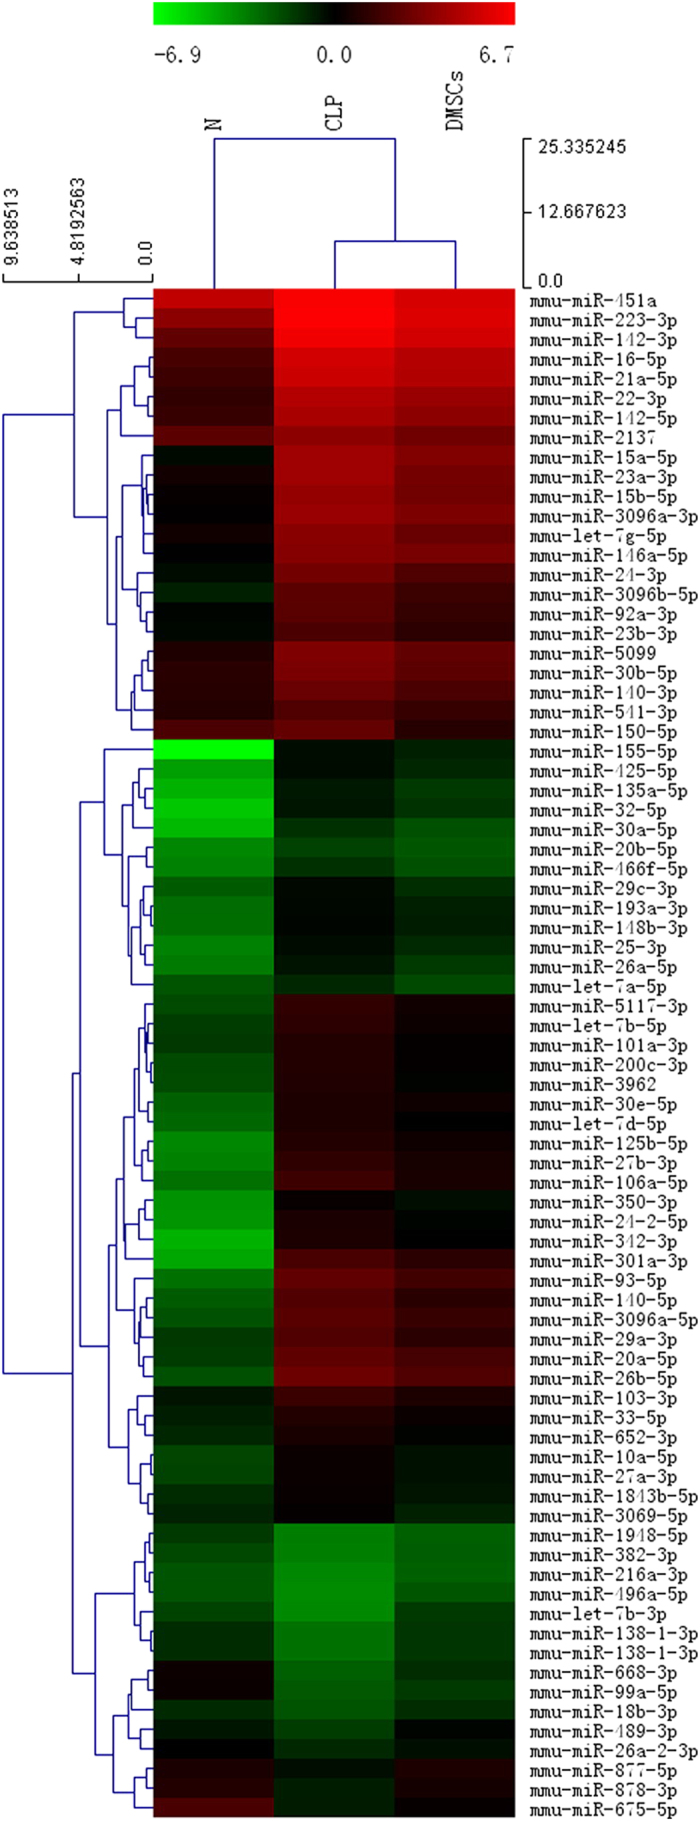
We performed microarray analysis for miRNA expression with RNA extracts from murine peritoneal macrophages. We visualized the relative fold change expression of experimental conditions compared with Sham/saline using a heat map: green = underexpression; black = no change; red = overexpression.