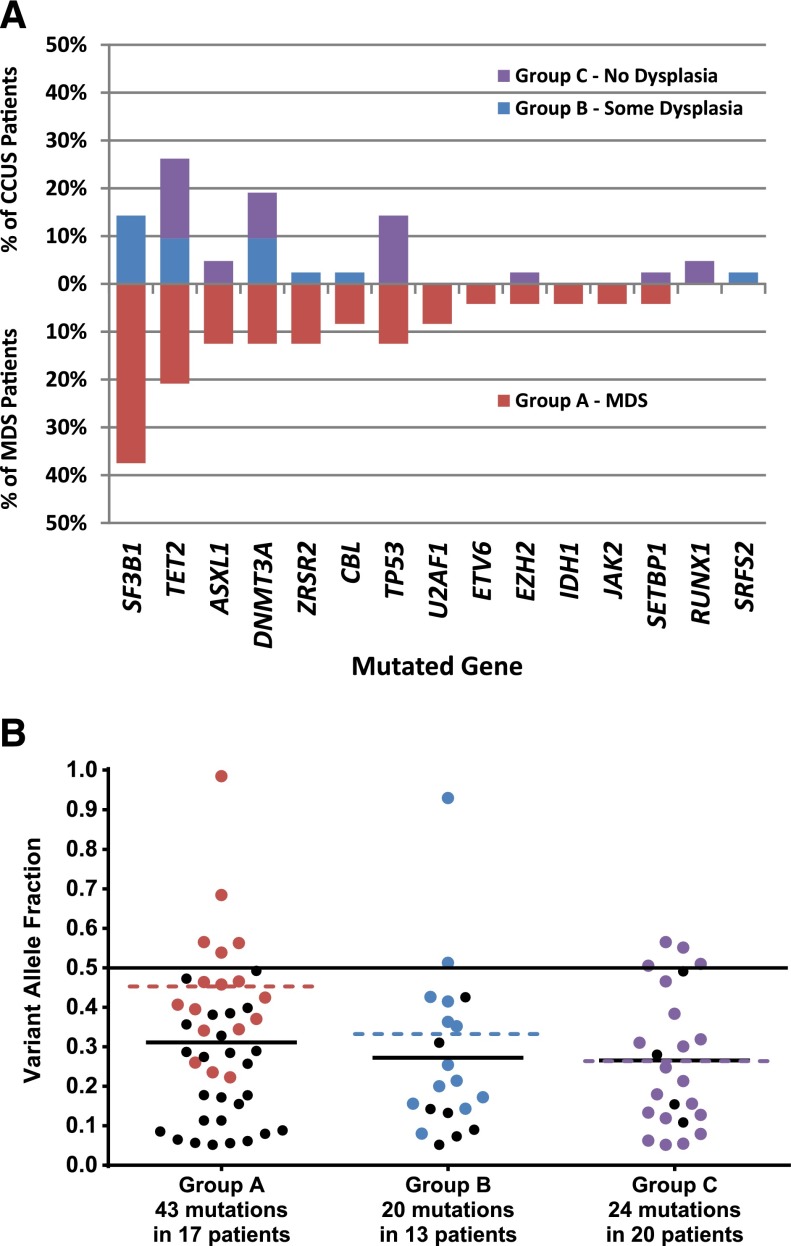
Figure 2.
Mutations and VAFs in prospective study groups. (A) The frequency of mutations in each gene listed on the x-axis is shown for prospective cohort patients with MDS (red bars in lower half) and CCUS, separated by whether dysplasia was seen in the bone marrow or not (blue and purple bars, respectively, in upper half). (B) Variant allele fractions by diagnostic group. The VAF for each mutation identified in the prospective MDS and CCUS groups is shown. Colored dots represent the highest VAF found in a patient whereas black dots represent mutations with VAFs less than the maximum for a given patient. The colored dotted lines represent the mean of the highest VAFs (colored dots) whereas solid black lines represent the mean of all mutations (colored and black dots).

