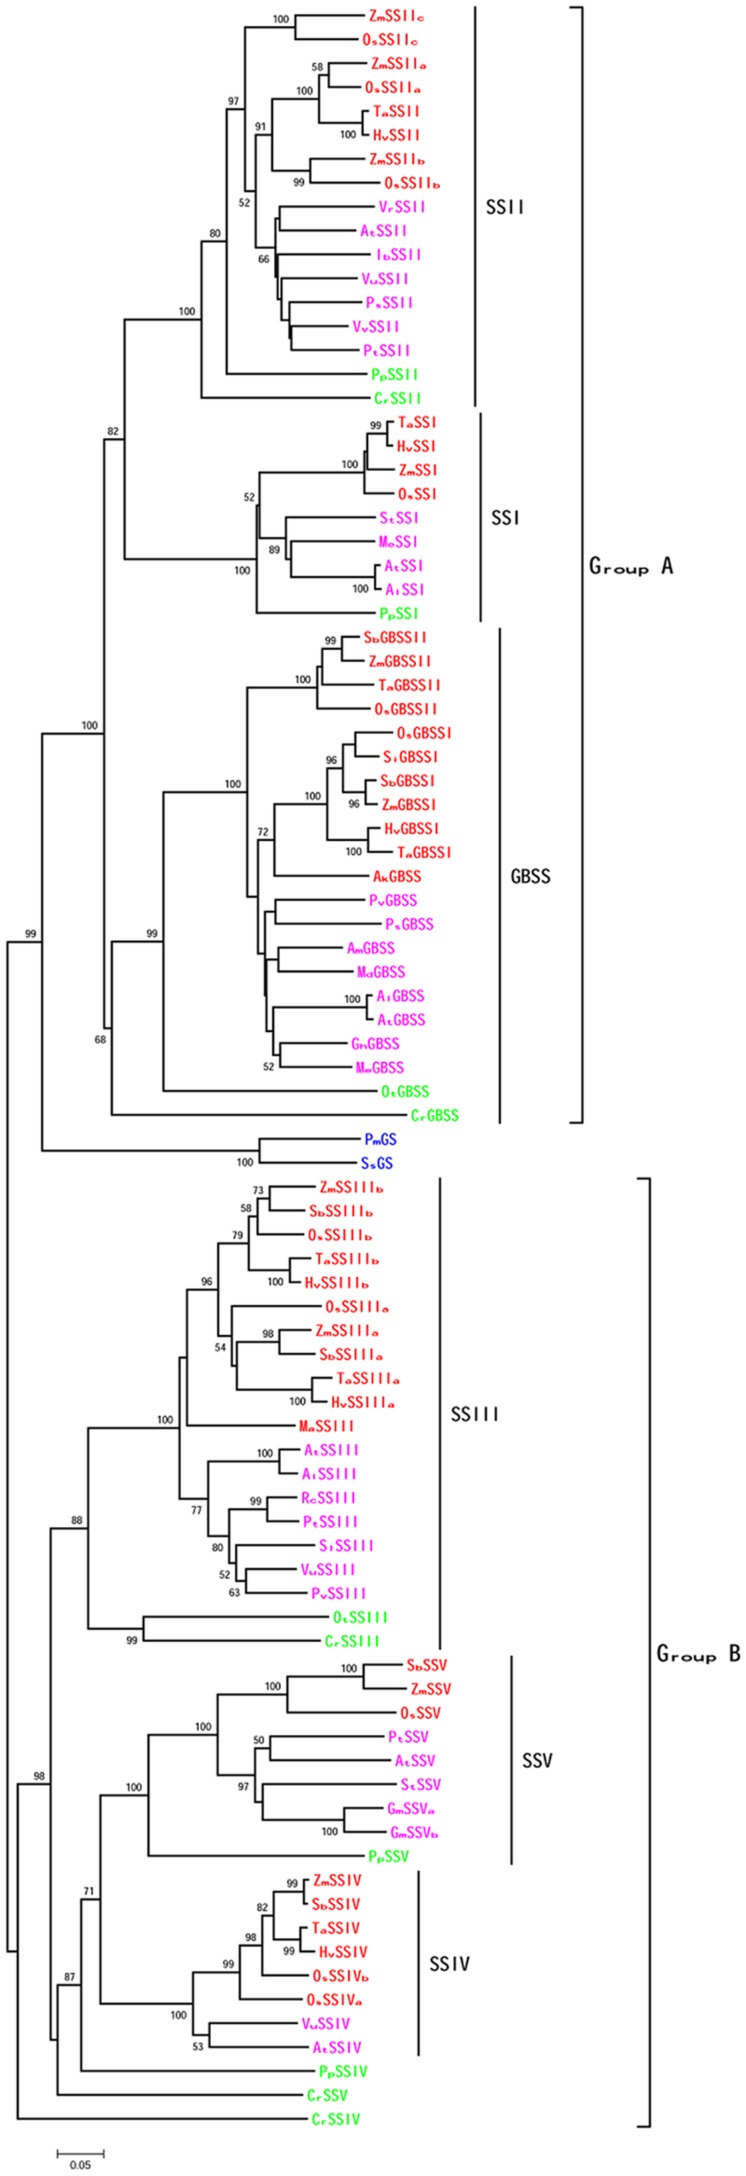
FIGURE 3.
Phylogenetic tree showing the relationship among plant SSs. The tree was constructed using the neighbor-joining method, and numbers on branches represented bootstrap estimates for 1000 replicate analyses, only bootstrap scores higher than 50 were shown. Each node was labeled with the prefix of the initials of the genus and species. Monocots were showed in red, eudicots in pink, algae and moss in green, and bacteria in blue.

