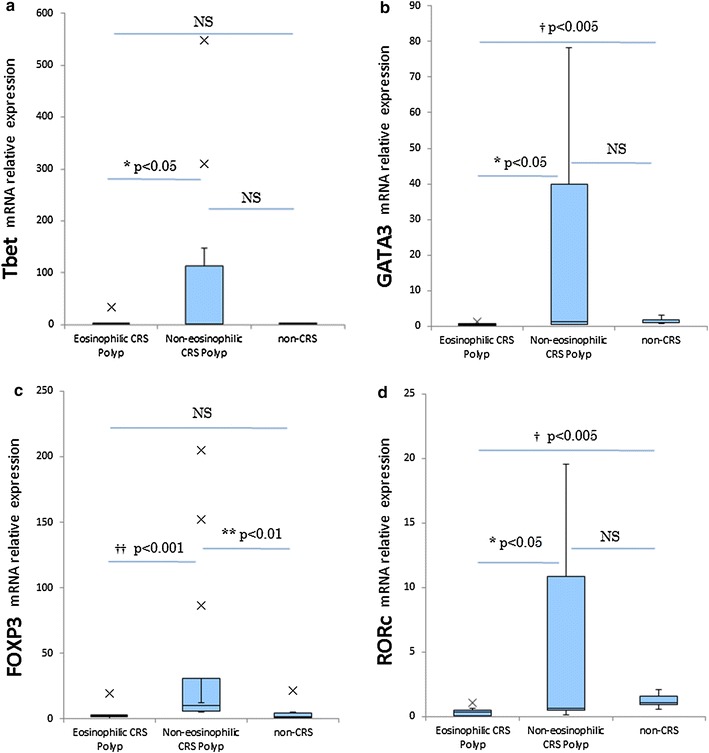
Fig. 5.

mRNA expression of transcription factors (T-bet, GATA-3 FOXP3, RORc) involved in naive T-cell differentiation in ECRS, non-ECRS and non-CRS controls. The box represents the distribution of values; the line across the box represents the median; the box stretches from the lower hinge (the 25th percentile) to the upper hinge (the 75th percentile). ×, outliers (††p < 0.001, †p < 0.005, *p < 0.05)
