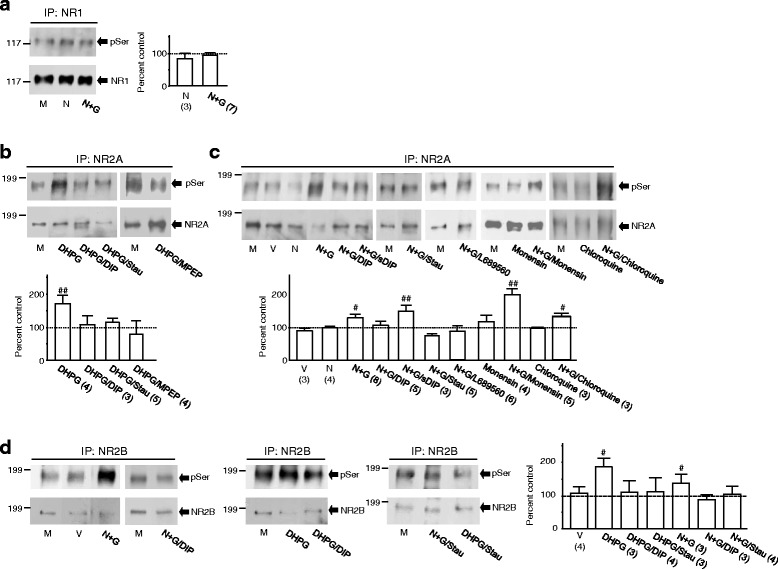
Fig. 4.

NMDAR internalization causes increases in serine phosphorylation of surface NMDARs. Blots shown in (a - d) are examples of experiments, in which NMDA GluN1 (a), GluN2A (b and c) or GluN2B (d) proteins was immunoprecipitated from the synaptic plasma membrane (LP1) of cultured neurons treated with agents in bath as indicated underneath the blots. The same filters were then stripped off and successively probed with anti-phosphoserine antibody (pSer, upper blots) and NMDAR antibodies (lower blots) for the GluN1 (a), GluN2A (b and c) or GluN2B (d) subunit. The ratio of band intensity showing phosphorylated versus that of total GluN1, GluN2A or GluN2B subunit proteins was normalized to the ratio in neurons treated only with culture medium (control, = 100 %, dashed line in bar graphs). Bar graphs show summary data (mean ± SEM). M: culture medium (M), V: vehicle, N: NMDA (1 mM), N + G: high NMDA/glycine (1 mM NMDA and 100 μM glycine). Effects of DHPG (50 μM) were also examined in neurons treated with DIP (50 μM, DHPG/DIP), staurosporine (1 μM, DHPG/Stau) or MPEP (10 μM, DHPG/MPEP); Effects of N + G were also examined in neurons treated with DIP (N + G/DIP), sDIP (N + G/sDIP), staurosporine (1 μM, N + G/Stau), L689560 (10 μM, N + G/L689560), monensin (10 μM, N + G/momemsin) or chloroquine (200 μM, N + G/chloroquine). #, ##: P < 0.05, 0.01 (Independent t-test) in comparison with control (M). Values in brackets indicate the number of experimental repeats
