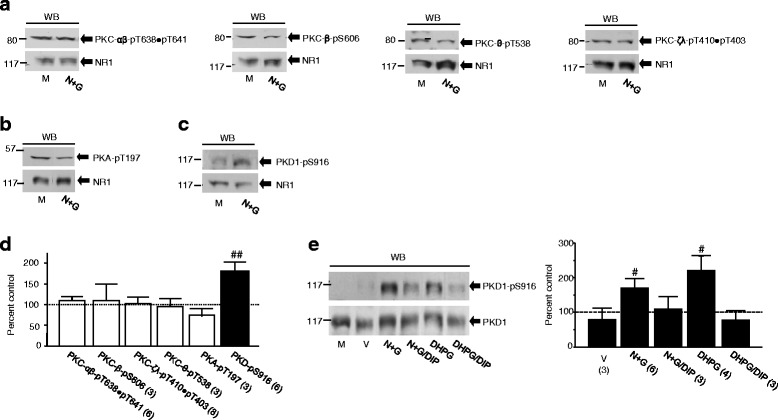
Fig. 5.

The event of NMDAR internalization activates PKD1. Upper blots (from left to right) shown in (a) represent examples of Western analysis with an antibody for phosphorylated T638 and T641 in PKC-α and β, phosphorylated S606 in PKC-β, phosphorylated T538 in PKC-θ or phosphorylated T410 and T403 in PKC-ζ and λ. Upper blots in (b and c) show examples of experiments with antibodies recognizing phosphorylated T197 in PKA and phosphorylated S916 in PKD1, respectively. Lower blots in (a - c) show GluN1 proteins detected in each experiment. The ratio of band intensity showing phosphorylated enzymes versus that showing GluN1 subunit protein detected in the same lysates was normalized with the ratio in neurons treated with culture medium (M, control, =100 %, dashed line in d). Bar graphs in (d) show summary data (mean ± SEM) of the normalized ratios. For blotting analysis shown in (e), PKD1 was immunoprcipitated with an antibody recognizing both phosphorylated/active and non-phosphorylated/inactive PKD1 from neurons treated with agents in bath as indicated. The same filters were stripped and successively probed with antibodies recognizing active PKD1 (upper blot) and total PKD1 (lower blot). The ratio of band intensity of active versus that of total PKD1 was normalized to the ratio in neurons treated only with culture medium (M, control). Bar graphs show summary data. #, ##: P < 0.05, 0.01 (independent t-test) in comparison with control
