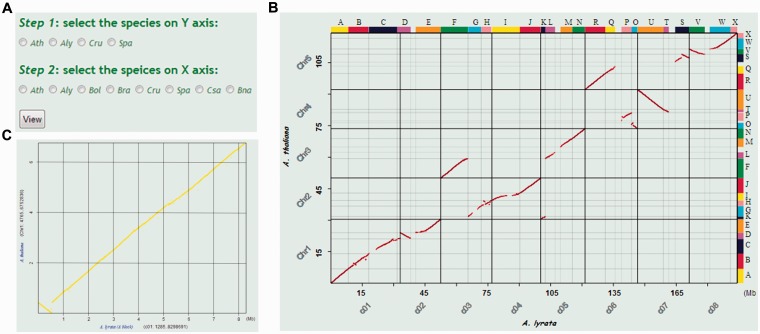
Figure 2.
Obtaining pairwise syntenic dot plots between two Brassicaceae genomes in BRAD V2.0. The ‘Syntenic figure’ option is selected by placing the cursor over the Search section and clicking on ‘Syntenic figure’. (A) Select the Brassicaceae species genomes to be plotted. (B) Syntenic figure between A. thaliana and A. lyrata. Syntenic gene pairs are plotted as red dots. Genomic blocks are shown as color-coded bars labeled A–X on the top and right sides of the plot. The genome sequences of A. lyrata and A. thaliana are displayed on the x and y axes, respectively. (C) Syntenic figure of local genomic block A obtained by clicking on the corresponding block. Chromosome labels and the intervals of the A block are given in brackets after the labels on the two axes.

