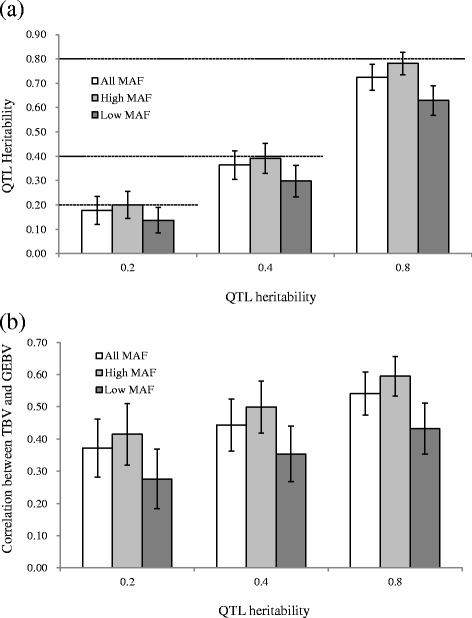
Fig. 3.

Results obtained from scenario 1. Estimated QTL heritability and correlation between true breeding and genomic estimated breeding values are calculated. The x-axis indicates the true QTL heritability, and the y-axis represents mean values of 300 replicates for the estimated QTL heritability (a) and the correlation between true breeding value (TBV) and genomic estimated breeding value (GEBV) (b). The results of varying minor allele frequency (MAF) categories (All, Low, and High) and QTL heritabilities (0.20, 0.40, and 0.80) are shown. The whiskers represent the standard deviation of 300 replicates
