
Fig. 4.
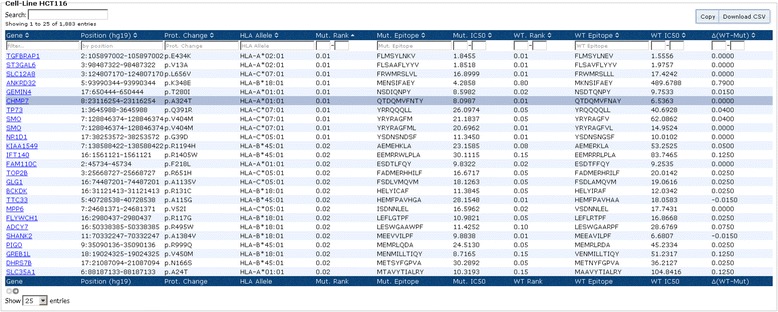
Neo-epitope catalog of HCT116. Columns 1 to 3 describe the mutation, columns 4 to 7 show the HLA allele, the percentile rank, the sequence, and the IC50 of the predicted strongest binding neo-epitope, respectively. Columns 8 to 11 show information for the corresponding wild-type sequence. The marked row is the neo-epitope eluted and identified by mass spectrometry [27]