
Fig. 4.
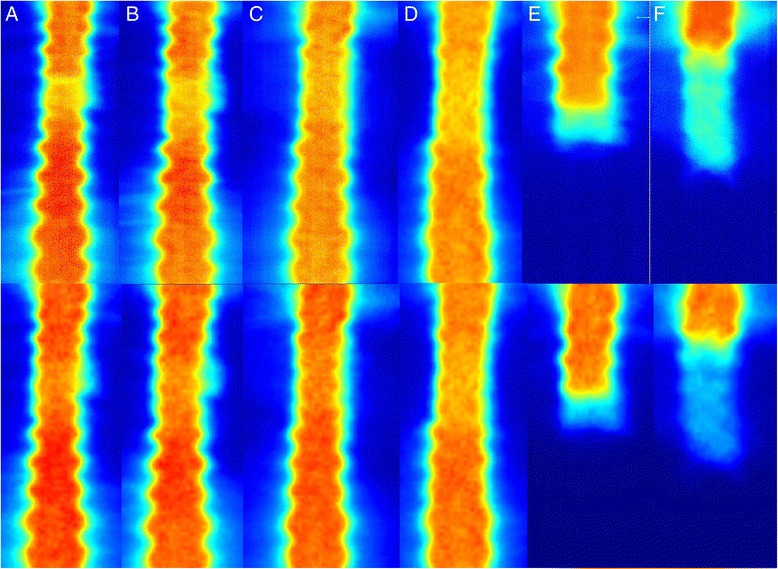
Dose distributions in the junction regions of arc beams with different isocenters and collimator angles. The upper and lower parts were the measured (by films) and calculated dose distributions, respectively. From Part a to Part f: the collimator angles of the upper and lower arc beams were 0°/0°, 0°/5°, 30°/30°, 45°/45°, 0°/NA, 30°/NA, respectively. The Part e and Part f were the dose distributions of the beams with the upper isocenter. The dose was normalized to 180cGy