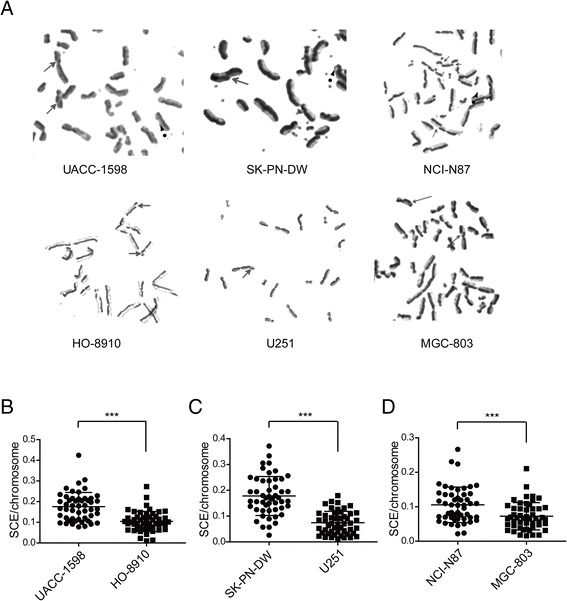
Fig. 1.

The SCE phenomenon in each cell line. a. SCEs were found in both groups of cell lines and are indicated by the straight arrows. The dotted arrows indicate DMs in the DM-positive cells. b–d The numbers of SCEs are shown for the UACC-1598, HO-8910, SK-PN-DW, U251, NCI-N87 and MGC-803 cells. Data are shown as mean ± standard deviation (SD). *** indicate P < 0.001 with t -test analysis
