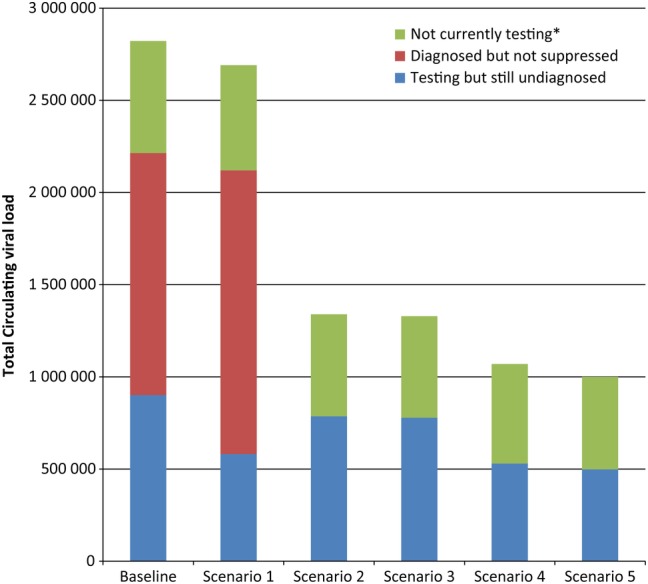
Figure 2.

Synergistic effects of human immunodeficiency virus (HIV) testing frequency, test sensitivity, and viral suppression among the diagnosed population on the median 3-year total of circulating viral load, by HIV testing and diagnosis group of men who have sex with men in a simulated population. Scenario 1 increased HIV testing frequency to once every 90 days and held the percentage of the diagnosed population that achieve viral suppression to 43.4% and test sensitivity to 45 days as in the baseline scenario. Scenario 2 increases the proportion achieving viral suppression to 100% of the diagnosed population, while keeping the baseline scenario for testing frequency and test sensitivity. Scenario 3 increases both viral suppression (to 100% of the diagnosed population) and test sensitivity (to 22 days), while holding testing frequency to the baseline distribution. Scenario 4 increases testing frequency to every 90 days and increases viral suppression to 100%, while holding test sensitivity to 45 days. Scenario 5 optimizes all 3 strategies at once, with viral suppression increased to 100% of the diagnosed population, testing every 90 days, and a test with a 22-day window period.
