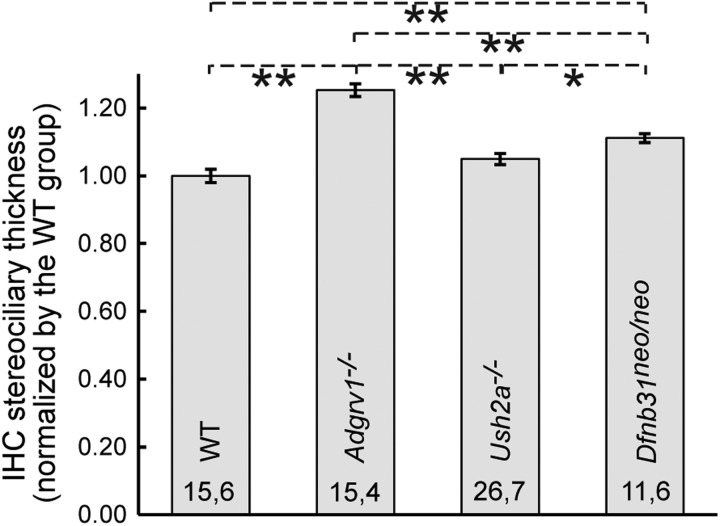
Figure 8.
Quantification of stereociliary thickness in Adgrv1−/−, Ush2a−/− and Dfnb31neo/neo IHCs. Stereociliary thickness was measured using ImageJ on high-magnification SEM images as described in the Materials and Methods section. Student's t-tests were conducted to analyze the significance of differences among genotype groups. Numbers of cells and animals examined in each genotype group are indicated before and after the comma, respectively. *P < 0.05, **P < 0.01; error bars, standard error of the mean.

