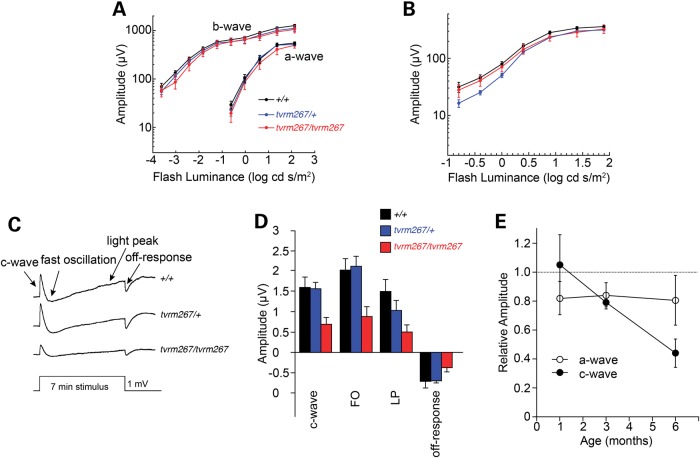
Figure 9.
Electroretinographic anomalies in Adamtsl4tvrm267 mutants. (A) Luminance response functions for the amplitude of the major components of dark-adapted strobe flash ERGs obtained at 6 months of age. Note that a- and b-wave response functions are very similar for +/+, tvrm267/+ and tvrm267/tvrm267 littermates. (B) Luminance response functions for amplitude of the light-adapted ERGs obtained at 6 months of age. In (A and B), data points indicate the average ± SEM of 6–8 mice. (C) Average dc-ERGs obtained to a 7 min duration stimulus from +/+, tvrm267/+ and tvrm267/tvrm267 littermates. (D) Amplitude of the major components of the dc-ERG obtained from +/+, tvrm267/+ and tvrm267/tvrm267 littermates. In (C and D), waveforms and bars indicate the average of 6–11 mice and error bars in (D) indicate standard error of the mean (SEM). (E) Relative amplitude of the strobe flash ERG a-wave and the dc-ERG c-wave as a function of age. For each measure, average ± SEM response measures of homozygous tvrm267 mice are expressed relative to the average response of WT and heterozygous littermates tested in parallel. Note that there is an age-related reduction in the dc-ERG c-wave while there is no age-related change in the strobe flash ERG a-wave.

