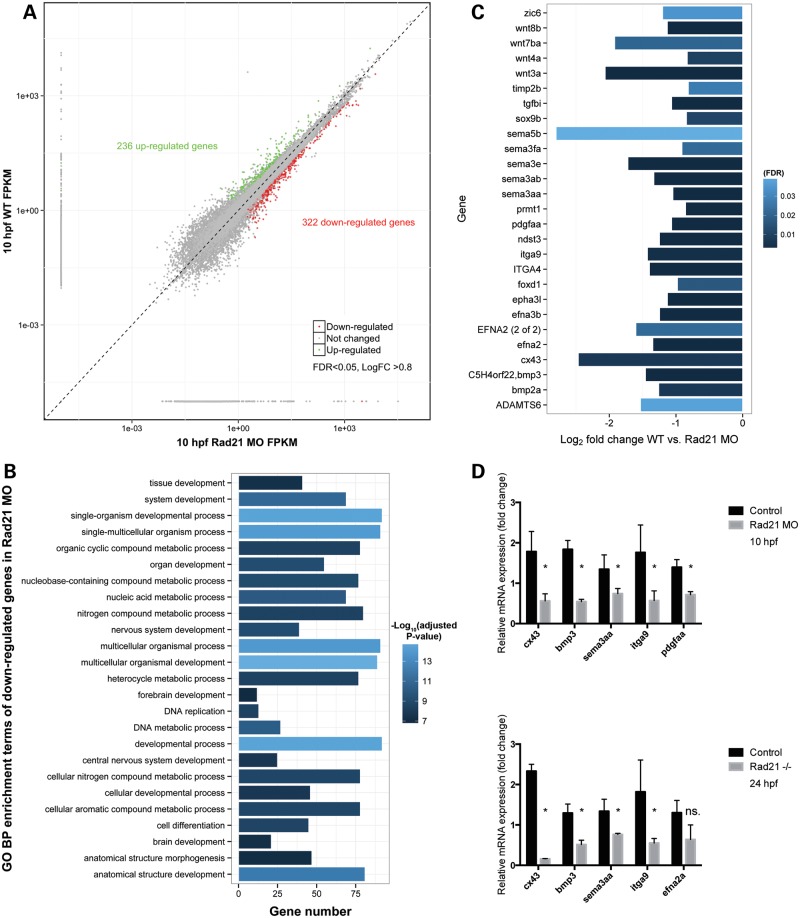
Figure 7.
Genes involved in neural crest function are dysregulated upon Rad21 depletion in eight-somite zebrafish embryos. (A) Scatter plot comparing global gene expression profiles between wild-type and Rad21 ATG MO knockdown (Rad21 MO, 0.5 pmol MO) 10 hpf embryos (8 somites). Differentially expressed genes (false-discovery rate FDR < 0.05, log2 fold change >0.8) are marked in green (up-regulated) and red (down-regulated). (B) GO term enrichment analysis was performed on down-regulated genes in Rad21 MO using the R package ClusterProfiler (52) using a cutoff of 0.05 FDR corrected P-value. Bar lengths represent number of genes in each category, bar color stands for the −log10 of the adjusted P-value of each GO term. No significant GO enrichment was found in the up-regulated gene set. (C) Bar graph of genes involved in neural crest development showing fold change and FDR in bar color. Neural crest genes were those identified by Kirby and Hutson (29). Raw data including direction and degree of regulation can be found in Supplementary Material, Table S1, and information on transcriptome production and analysis can be found in the Supplementary Methods. (D) Confirmation by qRT–PCR of dysregulated expression of candidate neural crest-related genes identified by RNA-seq in 10 hpf Rad21 ATG MO embryos (0.5 pmol MO). Dysregulated expression was similar to that observed in rad21nz171 homozygous mutants at 24 hpf. The vertical axis shows the relative mRNA expression normalized to rpl13a and actb mRNA. Data are means of three independent biological replicates ±SEM; asterisks indicate significant changes in expression, P-value < 0.05.

