Figure 7.
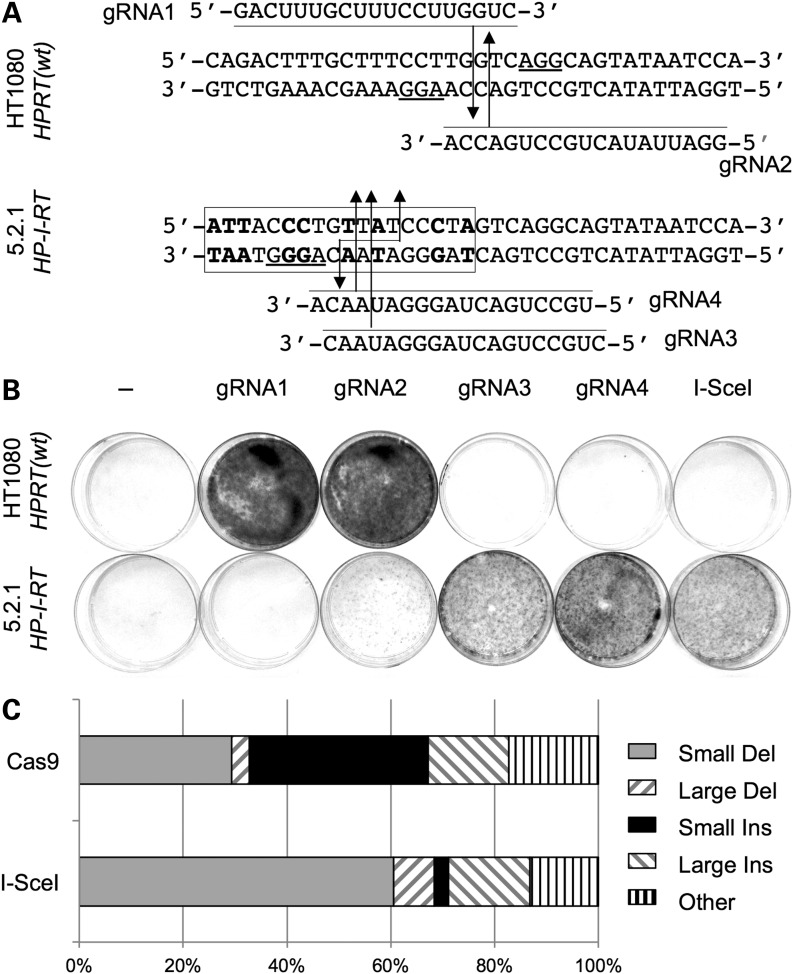
Cas9-induced HPRT mutagenesis. (A) Design of exon 6-targeted gRNAs. Part of the exon 6 sequence in WT cells or clone 5.2.1 is shown. The I-SceI site is boxed with non-WT residues shown in bold and the cleavage site indicated (staggered arrows). Target-specific regions of gRNAs are shown, aligned with their target. For each gRNA, the predicted Cas9 cleavage site is indicated by an arrow, 3 nt upstream of the protospacer-adjacent motif (underlined). (B) Stained petri dishes after selection of transfected HT1080 or clone 5.2.1 cells (106 cells per dish) in 6TG. Cells were lipofected with DNA encoding no nuclease (column 1), Cas9 and the indicated gRNA (columns 2–5), or I-SceI (column 6). Cells from the same transfection shown in (B) were plated at lower dilutions and selected in 6TG and used to determine frequencies (Materials and Methods; Table 3, Experiment 1). (C) Relative proportions of different classes of I-SceI- or Cas9-induced mutations (data from Fig. 4D and E; Supplementary Material, Fig. S3).

