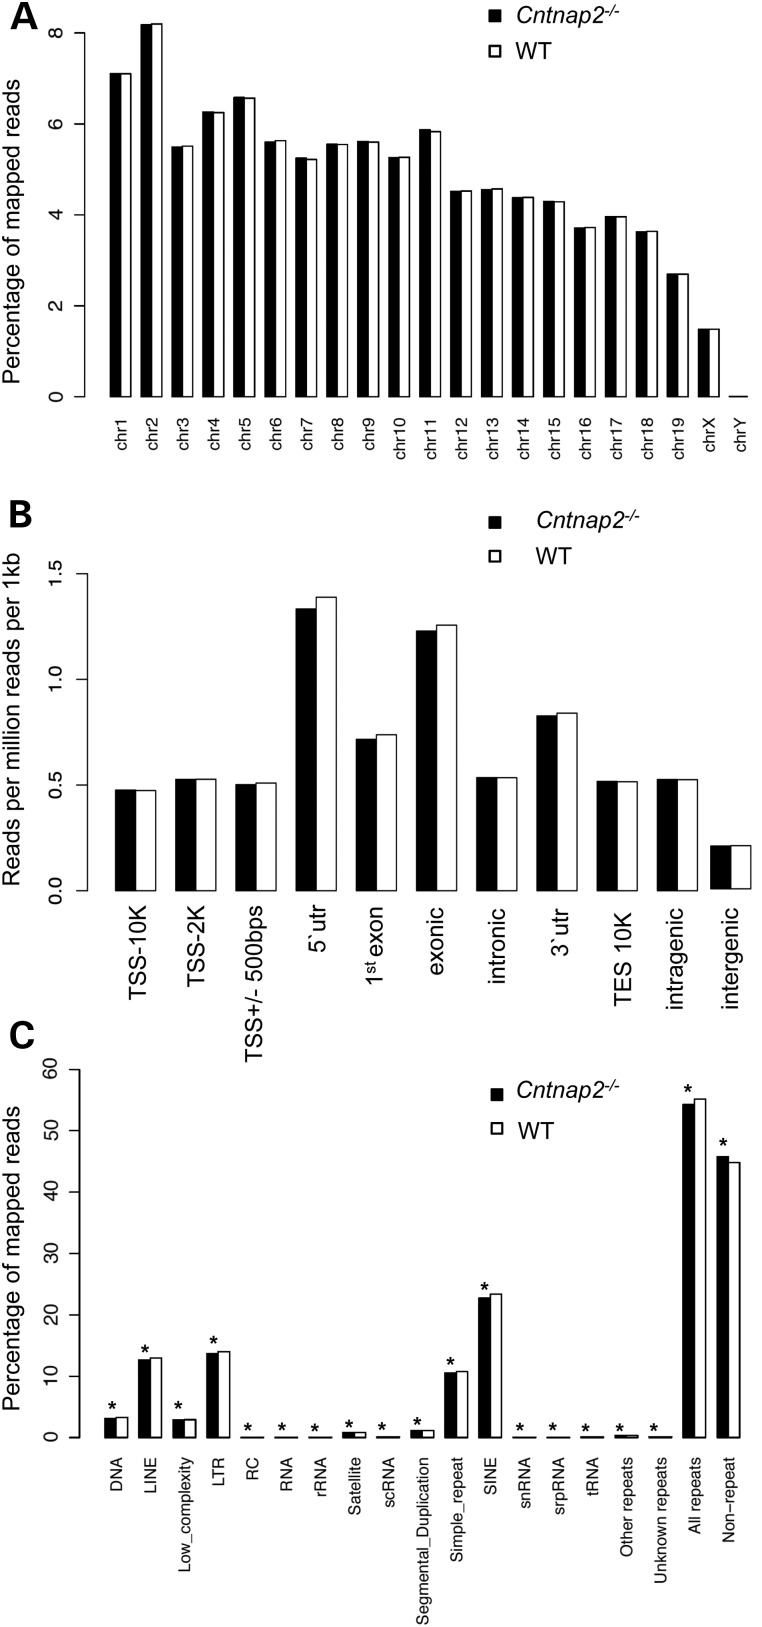
Figure 1.
Distribution of sequence reads. The percent distribution (A and C) or the number of reads per million reads per 1 kb (B; y-axis) of monoclonal reads that passed QC for each chromosome (A), standard genomic structure (B) and repetitive element (C) in Cntnap2 (black) and WT (white) mice are shown. (B) The standard genomic structures are defined as the following: 10 kb upstream of the transcription start site (TSS; TSS-10K); 2 kb upstream of the TSS (TSS-2K); 500 bp flanking the TSS (TSS+/−500 bp; 5′ UTR; first exon; exonic; intronic; 3′ UTR; 10 kb downstream of the TES (TES10K); intragenic; or intergenic regions. Asterisk denotes a binomial P-value = <0.001).

