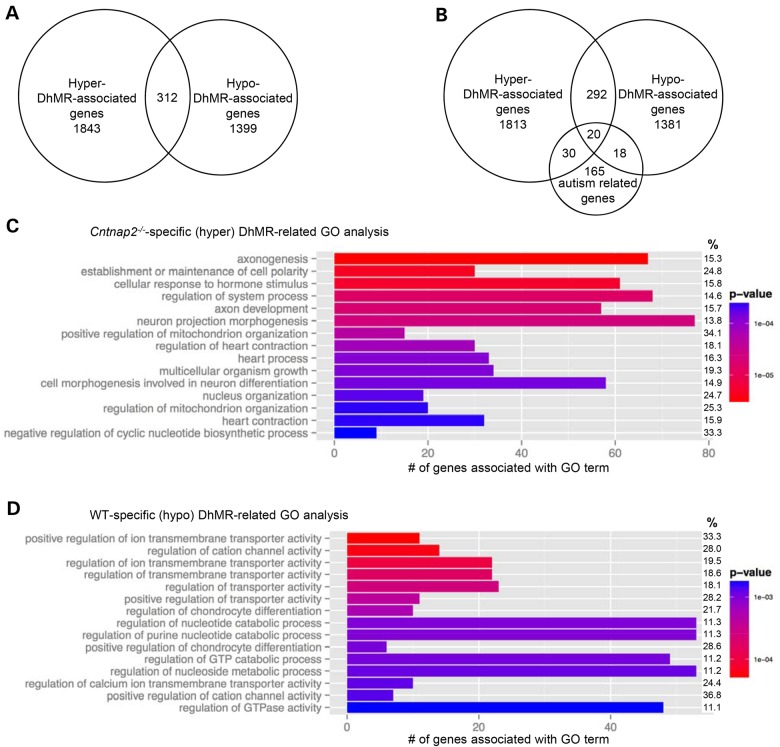
Figure 3.
Annotation of DhMRs to genes. (A) DhMR-associated genes. Venn diagram showing the proportion and overlap of hyper-DhMR-associated genes (N = 1843) and hypo-DhMR-associated genes (N = 1399). The overlap indicates that some genes have both hyper- and hypo-DhMR-associated genes (N = 312). (B) The relative location of DhMRs annotated to two biologically relevant genes. Each gene structure shown contains the transcription start site (broken arrow) and the relative positions of exons (vertical black bar), introns (line connecting exons) and DhMRs (gray boxes), which are below [WT-specific (hypo), Neurexin1] or above [Cntnap2-specific (hyper), Reelin] the gene diagram. (C) Comparison of known autism-related genes. Venn diagram showing the proportion and overlap of hyper- and hypo-DhMR-associated genes and known autism-related genes (N = 233). (D–E) Top 15 GO BPs associated with the Cntnap2-specific (hyper)- and WT-specific (hypo)-DhMR-associated genes (D and E, respectively, ordered by statistical significance from the top of each figure). X-axis indicates the number of Cntnap2-specific (hyper)- and WT-specific (hypo)-DhMR-associated genes that are in each GO term. The shade of the bars shows the P-value based on the legend, as determined by a Fischer test. The % column indicates the proportion of DhMR-associated genes in the GO term compared with the number of genes forming the GO term.

