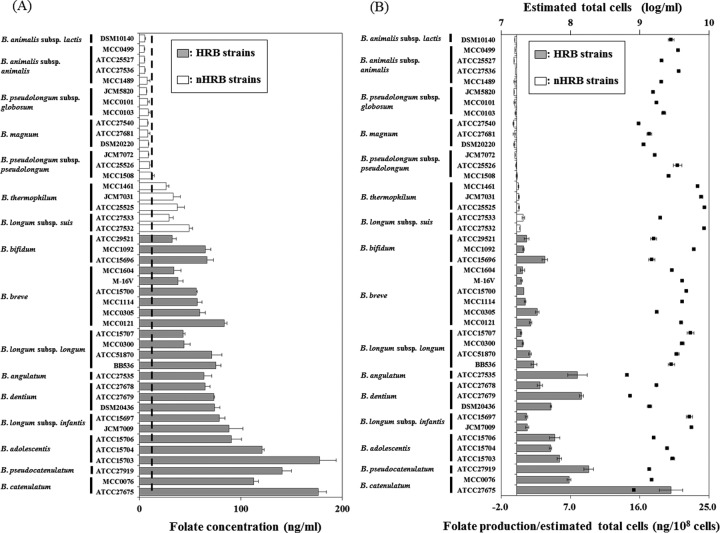
Fig. 1.
In vitro assay of folate synthesis by bifidobacterial strains
(A) Folate concentrations in culture supernatant after cultivation
Data are shown as the mean ± SD (n=3). Bars indicate folate concentrations. Dashed lines indicate averages of initial folate levels in MRSc broth.
(B) In vitro productivity of folate with growth of bifidobacteria
Folate production was calculated by subtracting the initial folate level (12.1 ng/ml) from the folate level of the culture supernatant. Data are shown as the mean ± SD (n=3). Bars indicate averages of net values of folate productivity per 108 cells, and black squares indicate averages of estimated total cells in MRSc broth after cultivation. Initial cells were approximately log 8.0 for each strain.

