
Figure 2.
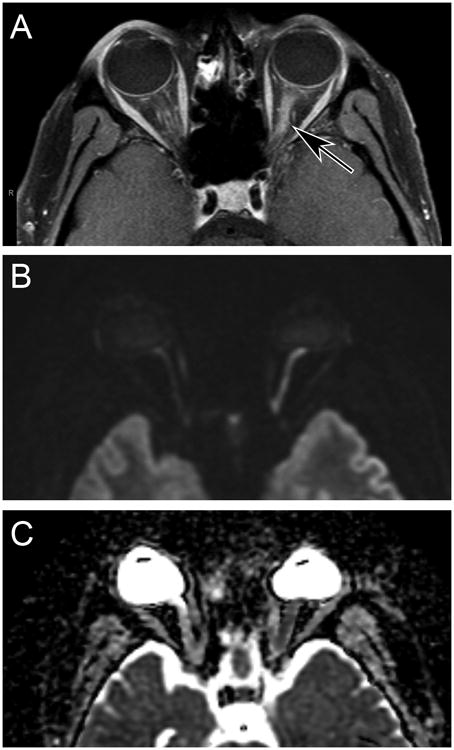
A) Axial T1-weighed magnetic resonance scan with fat saturation showing gadolinium enhancement of the left optic nerve (arrow). B) Diffusion-weighted image showing bright signal in the left optic nerve, corresponding to the gadolinium enhancement in (A). C) Apparent diffusion coefficient image, showing darker signal in the left optic nerve than the right optic nerve.