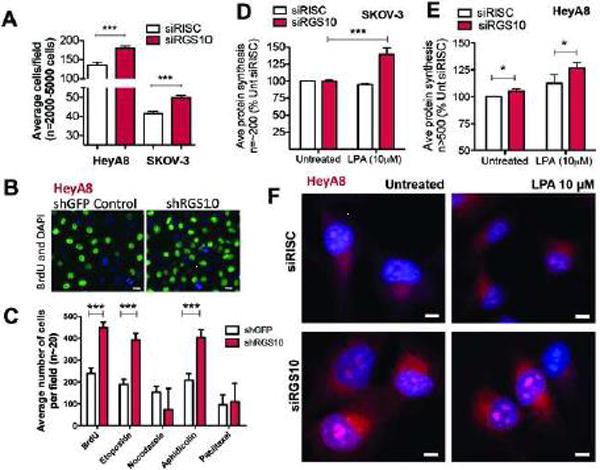
Figure 4. RGS10 suppression enhances ovarian cancer cell proliferation and protein synthesis.

(A) HeyA8 and SKOV-3 cells were transfected with either siRISC or siRGS10 and stained with DAPI. Cells were automatically counted using a high-throughput fluorescence imager and results are quantified as the average number of cells per field. The number of cells (n=2,000 – 5,000) observed among fields (n=15–100) across multiple experiments (n=3–6) were pooled together and displayed as a bar graph using GraphPad Prism. (B) Representative shGFP and shRGS10 HeyA8 cells were pulse-treated for one hour with a BrdU analog. Cells were fixed and then stained with DAPI and an anti-BrdU antibody prior to high-throughput imaging. The representative image shown here visualizes the fluorescence from HeyA8 cells and the difference between active proliferation among control cells and suppression of RGS10. (C) In other experiments, shGFP or shRGS10 stably-expressing HeyA8 cells were treated with different drugs or a BrdU analog prior to fixation, immunofluorescence staining and automatic cell counting. The average number of cells per field is shown and represents ~20 fields and thousands of total cells. ***p<0.001. Approximately (D) 2000 SKOV-3 cells or (E) 3000 HeyA8 were plated in complete media prior to siRNA transfection. The Click-iT® Plus OPP Alexa Fluor® 647 Protein Synthesis Assay Kit was used to measure protein synthesis. Cells were treated with LPA (10μM) for 60 min or left utreated. Approximately 200 (SKOV-3) or >500 (HeyA8) total cells were automatically quantified for fluorescence intensity, which corresponds to protein synthesis, and the data is presented as bar graphs normalized to siRISC untreated conditions (100%). *p<0.05, ***p<0.001. (F) Representative images from the previous experiment to measure protein synthesis are shown in HeyA8 cells.
