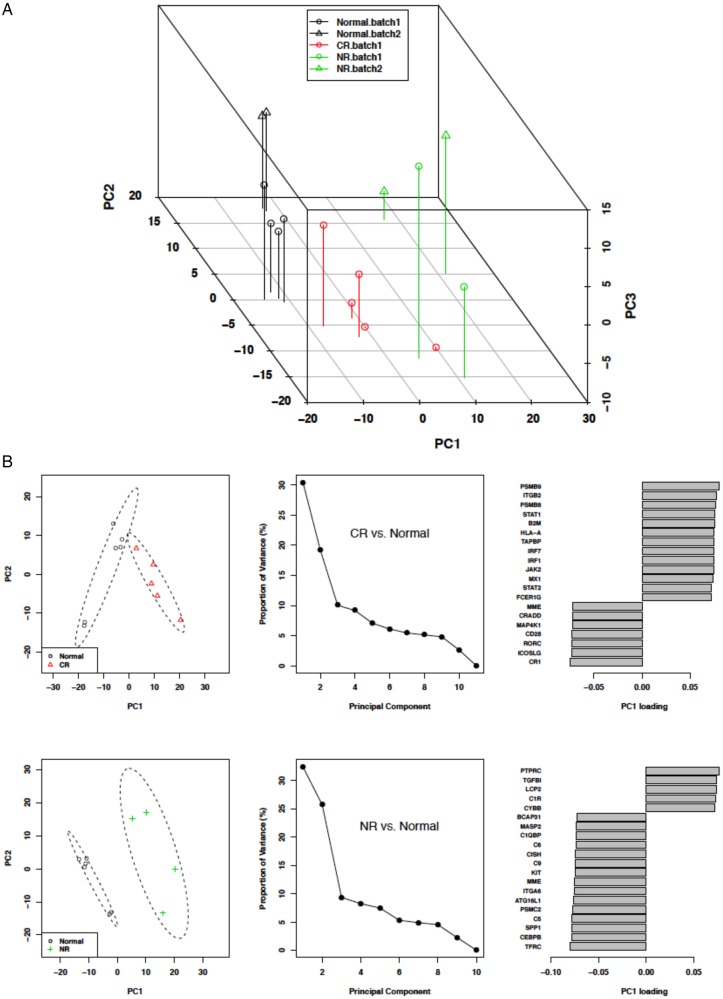
Figure 1.
Principal component analysis (PCA) of immune response gene expression in kidney biopsies. (A) The PCA based on gene expression data for complete responders (CRs), non-responders (NRs) and normal controls. The RNA analysis of this biopsy set was conducted in two batches. A batch effect adjustment was applied to prevent confounding and both batches are represented in the figure (batch 1, circles; batch 2, triangles). The normal controls were common to both batches. The PCA shows that CR (except for one patient), NR and normal controls groups clustered separately from each other. (B) A factor loading plot using flare data from CR and NR to identify the genes important for the clustering seen in the PCA. Principal component 1 (PC1) was used as it accounted for the highest proportion (35–50%) of variance. For each PC1 loading plot, only the top 20 genes ranked by absolute factor loadings for PC1 were selected. The plots show the top genes contributing to group clustering.

