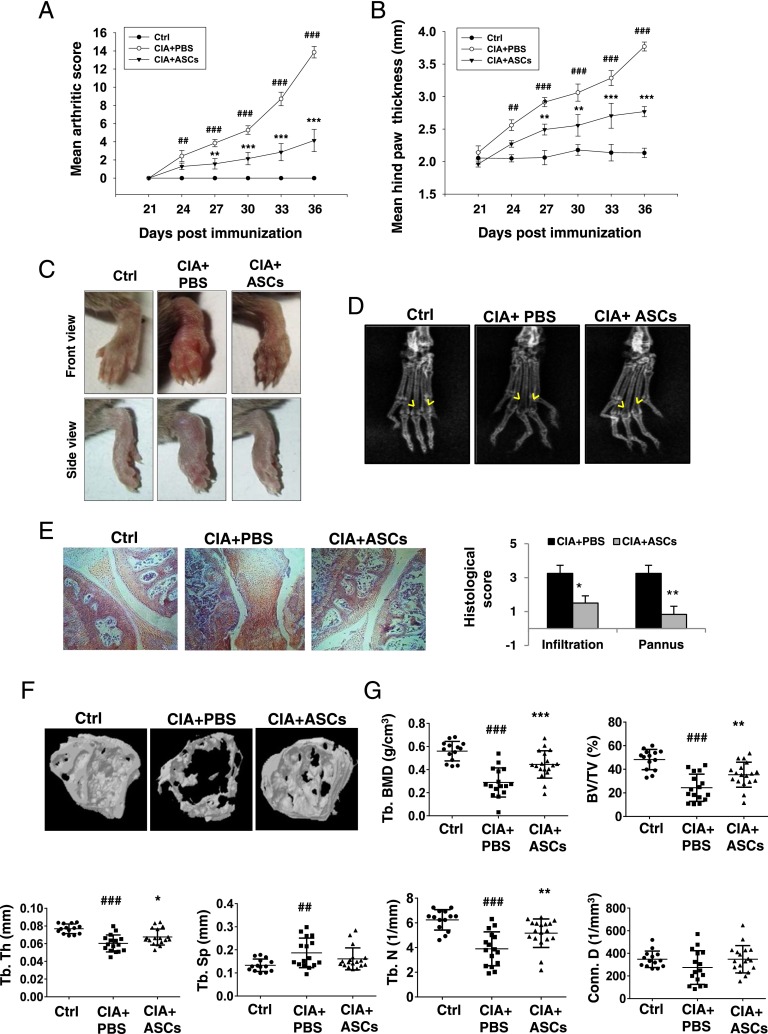
FIGURE 5.
ASCs decrease the disease severity and bone destruction in CIA. CIA was induced in 8- to 10-wk-old DBA/1J mice as described in Materials and Methods. On day 22, 2 × 10⁶ ASCs in 100 μl PBS were injected i.p. to one group and an equal volume of PBS to the other group of CIA mice. Severity of arthritis was evaluated by measuring mean arthritic score of four limbs per animal (A) and hindpaw thickness (B) until day 36. Data are presented as mean ± SEM (n = 6–7/group). Significance was calculated by two-way ANOVA followed by a Bonferroni multiple comparisions test between 1) control versus CIA plus PBS groups and 2) CIA plus PBS versus CIA plus ASC groups. Similar results were obtained in four independent experiments. Representative images (C) and radiographs (D) of hindpaws of mice on day 36 are shown. Yellow arrows in (D) show bone density at the metatarsophalangeal joints. (E) Sections of knee joints were stained with H&E and histologically evaluated for cellular infiltration and pannus formation (n = 4–6 mice/group). Original magnification ×10. Significance was calculated by a Student t test between CIA plus PBS and CIA plus ASC groups. Similar results were obtained in three independent experiments. Hindlimbs along with ankle joints were dissected out and analyzed for histomorphometric measurements using μCT. (F) Representative three-dimensional images of distal tibiae from control (nonarthritic), PBS-treated, and ASC-treated CIA mice. (G) Trabecular bone indices, including volumetric bone mineral density (trabecular BMD [Tb. BMD]), BV/TV, Tb. Th, Tb. Sp, Tb. N, and Conn. D, were quantified from μCT reconstructions. Data are pooled from three independent experiments and are presented as mean ± SD of 14–18 mice per group. Significance was calculated by a one-way ANOVA with a Bonferroni multiple comparisons test between 1) control versus CIA plus PBS groups and 2) CIA plus PBS versus CIA plus ASC groups. ##p ≤ 0.01, ###p ≤ 0.001 with respect to control group; *p ≤ 0.05, **p ≤ 0.01, ***p ≤ 0.001 with respect to CIA plus PBS group.

