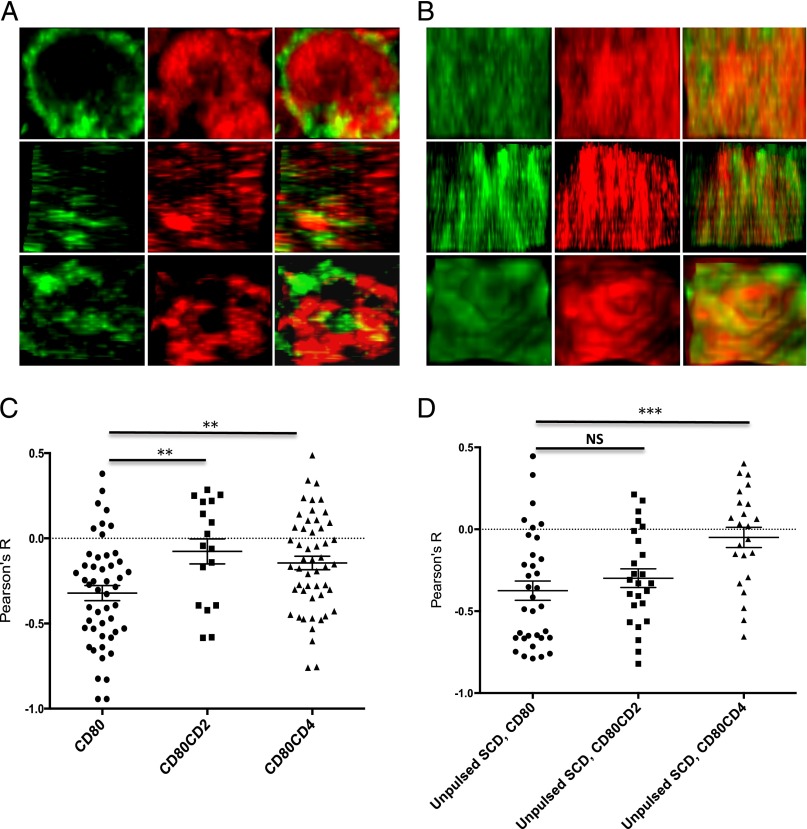
FIGURE 4.
Reduced CD45 segregation from elongated CD80. CHO-SCD cells expressing the indicated form of CD80-GFP were pulsed with pOVA (A–C) or left unpulsed (D) and incubated with primary CD8+ OT1 TCR T cells for 10 min. The conjugates were fixed, permeabilized, stained for CD45 using Alexa Fluor 647–conjugated anti-CD45 mAb, and imaged by confocal microscopy. (A) Representative en face views of the interface between pulsed CHO cells expressing CD80-GFP and T cells showing the distribution of CD80 (green) and CD45 (red). (B) Representative en face images of the interface between pulsed CHO cells expressing CD80-CD4-GFP and T cells showing the distribution of CD80 (green) and CD45 (red). Original magnification ×1000. (C and D) Pearson correlation coefficients between CD80 and CD45 in the indicated interfaces were calculated and collated. Horizontal lines with error bars represent mean and SEM. **p < 0.01, ***p < 0.001, one-way ANOVA.

