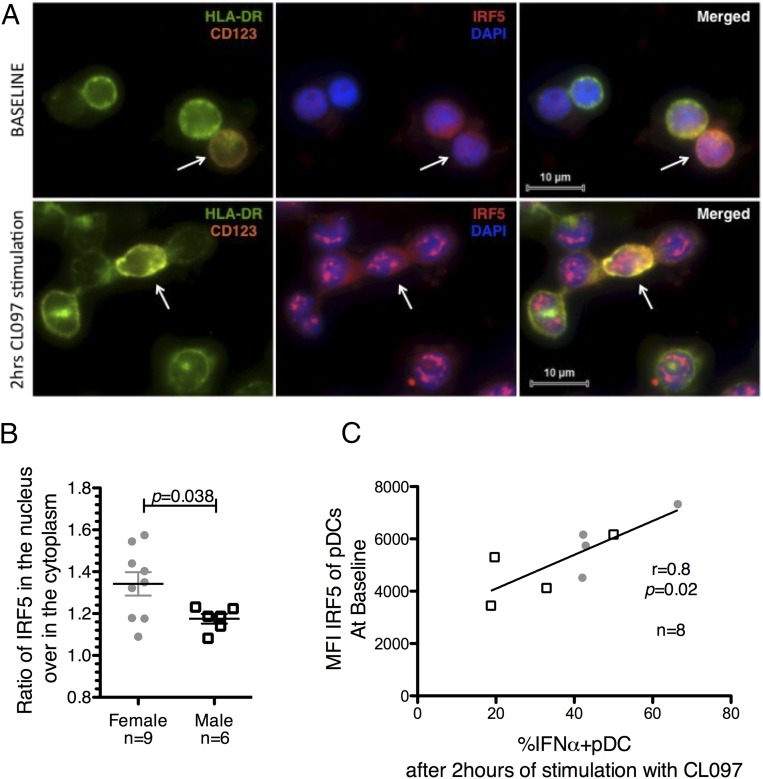
FIGURE 2.
IRF5 in pDCs is activated upon TLR7 stimulation and associated with IFN-α secretion. (A and B) PBMCs were stimulated with CL097 at 1 μg/ml for 2 h and then stained for IRF5–Alexa Fluor 546, HLA-DR–Alexa Fluor 488, and CD123–Alexa Fluor 647. The sample slides were scanned in Prolong Gold using the slide scanning system based on a Zeiss Axio Imager Z2 upright epifluorescence microscope. Images were captured using a Zeiss EC Plan-Neofluar 100× 1.3NA objective in combination with a PCO monochrome 12-bit CCD camera. pDCs were identified among all of the plated cells as HLA-DR+CD123+ cells. Quantification was performed using the TissueQuest analysis software. (A) Representative images at baseline and after 2 h of stimulation are shown with CD123 in orange, HLA-DR in green, DAPI staining of the nucleus in blue, and IRF5 in red. (B) The dot plot represents the ratio of nuclear IRF5 on cytoplasmic IRF5 in pDCs after 2 h of stimulation with CL097. Higher IRF5 ratio in the nucleus in females (n = 9) than in males (n = 6). Error bars indicate the mean and SEM. Comparison between sexes was calculated using unpaired t tests. (C) IRF5 and IFN-α expression were measured in pDCs at baseline and after 2 h of stimulation with CL097, respectively. A significant correlation between the basal levels of IRF5 in pDCs and the percentage of IFN-α–secreting pDCs after 2 h of stimulation with CL097 was observed. Linear regression was calculated in eight healthy donors (females: n = 4, close round shapes; males: n = 4, open squares) with Spearman rank-based correlation.

