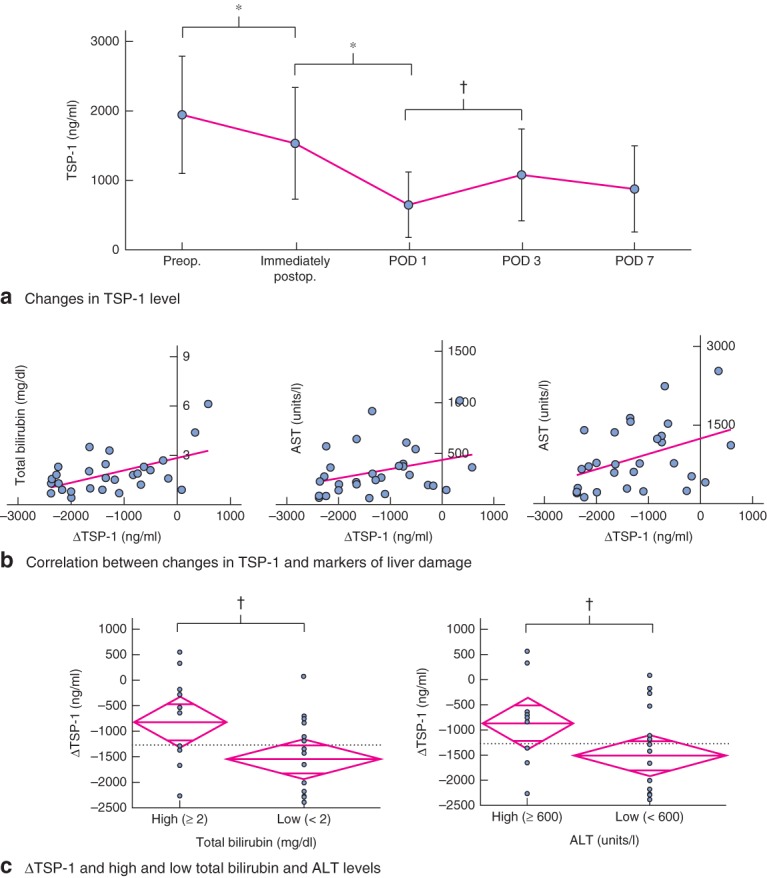
Fig. 5.

Plasma thrombospondin (TSP) 1 levels before and after hepatectomy. a Sequential changes in mean(s.d.) plasma TSP-1 concentration before and after hepatectomy (n = 30). POD, postoperative day. b Correlation between changes in plasma TSP-1 level, ΔTSP-1 (TSP-1Day1 − TSP-1Pre), and markers of liver damage including total bilirubin, aspartate aminotransferase (AST) and alanine aminotransferase (ALT) levels on POD 3. c Comparison of ΔTSP-1 in groups with high and low total bilirubin levels (left), and high and low ALT levels (right) on POD 3. The dotted horizontal line represents the mean of ΔTSP-1 for the two groups. The central line of the diamond indicates mean ΔTSP-1 in that group. The top and bottom points of the diamond represent 95 per cent c.i. calculated with error variance. The width of the diamond indicates the mean size of the group. The lines near the top and bottom of the diamond represent the overlap mark; if the interval between these lines for one group does not overlap the interval between these lines for another group, the group means are significantly different. a–c *P < 0·010, †P < 0·050 (Student's t test )
