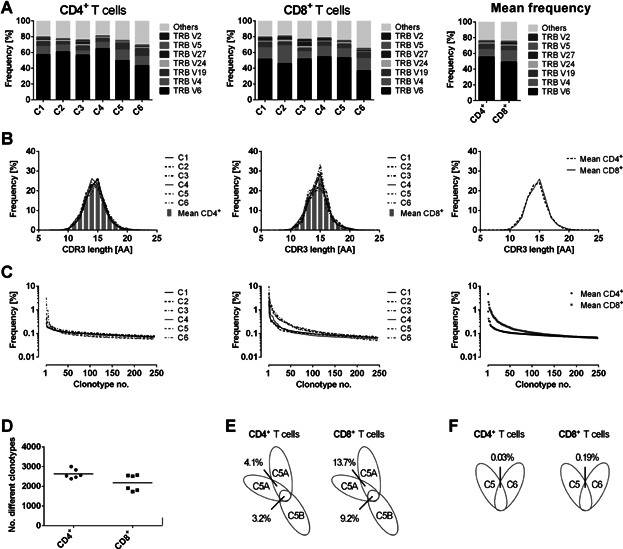
Figure 1.

TCRβ analysis in healthy control individuals. (A) Vβ subgroup usage of TCRs from CD4+ (left panel) or CD8+ (middle panel) T cells of six untreated healthy control individuals (designated as “C1” to “C6”). Seven of the most frequent Vβ subgroups were illustrated individually. The remaining subgroups were compiled. The nomenclature according to the international ImMunoGeneTics information system (IMGT) was used. The right panel shows mean frequencies of all six controls for CD4+ and CD8+ T cells. (B) HTS-derived CDR3 length distribution of CD4+ (left panel) or CD8+ (right panel) TCRβ sequences for each control donor. The right panel shows mean frequencies of all donors. TCRβ CDR3 size was defined as all amino acids (AAs) from the conserved cysteine in the Vβ segment to the conserved phenylalanine in the Jβ segment. (C) The left and middle panels show the individual clonotype frequency distribution of CD4+ or CD8+ T cells of each control donor. The right panel shows the mean values of CD4+ and CD8+ T cells of all control donors. Each dot represents the occurrence (percentage) of a distinct TCRβ clonotype. Only the clonotype frequencies for the first 250 clonotypes were illustrated. (D) Diversity dot plot of CD4+ and CD8+ T cells for six healthy control individuals. Each dot shows the number of unique clonotypes detected in one donor. The bars illustrate the mean value of the groups. (E) Overlaps of individual clonotypes in CD4+ or CD8+ T cells of one control donor sequenced twice out of one T cell preparation (5A) and of two separate cell sorts (5A/B). (F) Overlaps of individual clonotypes in CD4+ or CD8+ T cells of distinct control individuals.
