Figure 2.

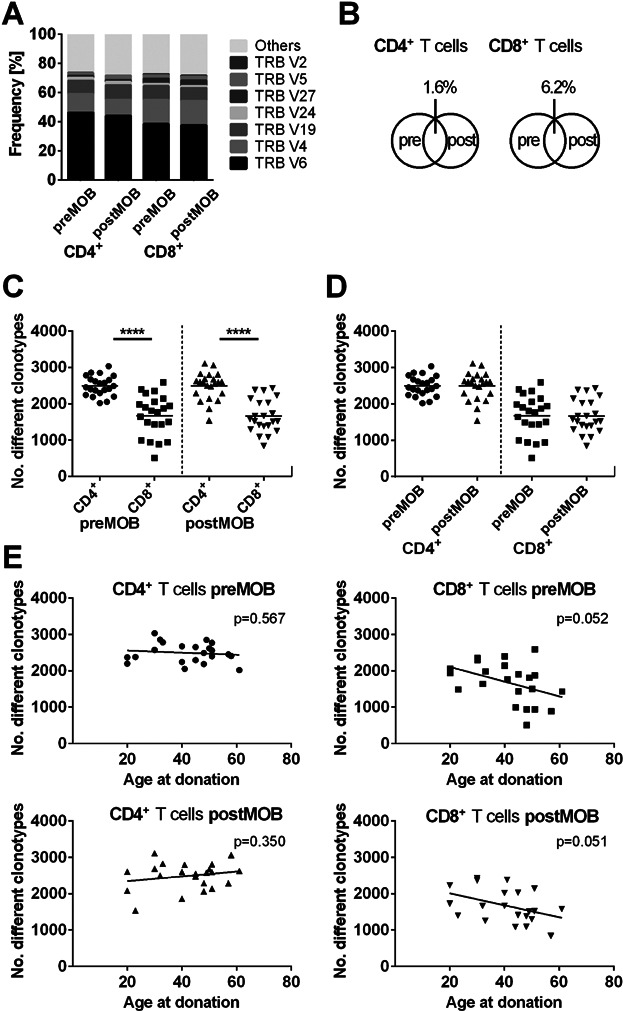
TCR analysis in stem cell donors before and after G-CSF induced mobilization. (A) Mean Vβ subgroup usage of TCRs from CD4+ or CD8+ T cells of 23 donors before (pre) and after (post) G-CSF induced stem cell mobilization. The seven most frequent Vβ subgroups were illustrated individually; the remaining subgroups were grouped together. The nomenclature according to the international ImMunoGeneTics information system (IMGT) was used. (B) Mean percentage of overlaps of individual clonotypes in CD4+ or CD8+ T cells of the 23 donors pre– and post–G-CSF–induced stem cell mobilization. (C and D) Diversity dot plots of CD4+ and CD8+ T cells pre– and post–G-CSF mobilization. Each dot represents the number of unique clonotypes detected in individual donors. (C) The number of clonotypes in CD4+ T cells differs significantly before and after G-CSF mobilization from the number of clonotypes in the CD8+ compartment (****p < 0.0001; n = 44). Bars show mean values. (D) The number of clonotypes in CD4+ and CD8+ T cells is not affected by G-CSF administration. (E) Scatter plots of CD4+ and CD8+ clonotype numbers and the age for stem cell donors pre– and post–G-CSF mobilization. The number of individual CD8+ clonotypes decreases with increasing donor age irrespective of G-CSF mobilization (preMOB: r = −0.42; p = 0.052; postMOB: r = −0.42; p = 0.051; n = 22). For CD4+ T cells, no negative correlation was found.  CD4+ T cells preMOB;
  CD4+ T cells postMOB;
  CD8+ T cells preMOB;
  CD8+ T cells postMOB.
