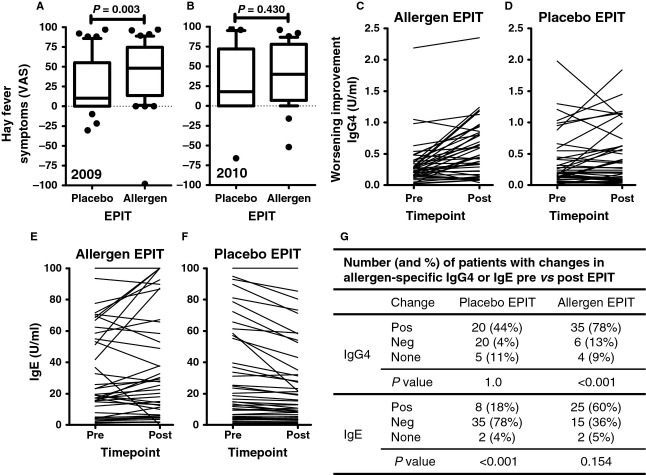
Figure 1.
(A) Improvement/deterioration of hay fever symptoms after treatment year 2009 and (B) treatment-free follow-up year 2010 as compared to pretreatment years recorded on a scale from −100 (worst possible deterioration) to +100 (best possible improvement). Box plots show the median, the 10th, 25th, 75th and 90th percentiles and outliers. (C, D) Allergen-specific IgG4 and (E, F) IgE responses pre- and posttreatment in 2009. One outlier is not shown in the placebo epicutaneous allergen-specific immunotherapy (EPIT) group IgG4 pre- (3.92)/posttreatment (4.32). (G) Inset table showing number and frequencies of patients with enhanced (pos) or reduced (neg) antibody response after EPIT in 2009.

