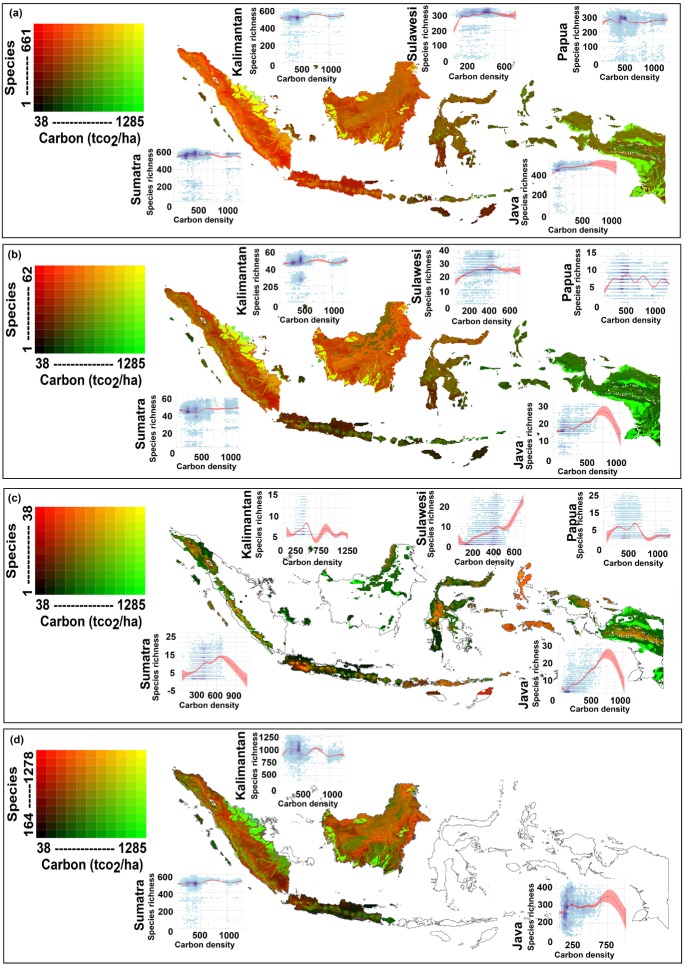
Figure 2.
The relationship between biomass carbon (above ground biomass and soil organic carbon) and measures of terrestrial species richness: (a) total vertebrate richness, (b) threatened vertebrate richness, (c) restricted range vertebrate richness, and (d) total vertebrate and plant richness (for Sundaland only) (species, number of species; carbon density units of measure, t CO2; 95% CI is displayed around the fitted general additive model; data for island graphs shown on a hexagonal grid shaded logarithmically from white to dark blue to indicate the degree of overplotting).

