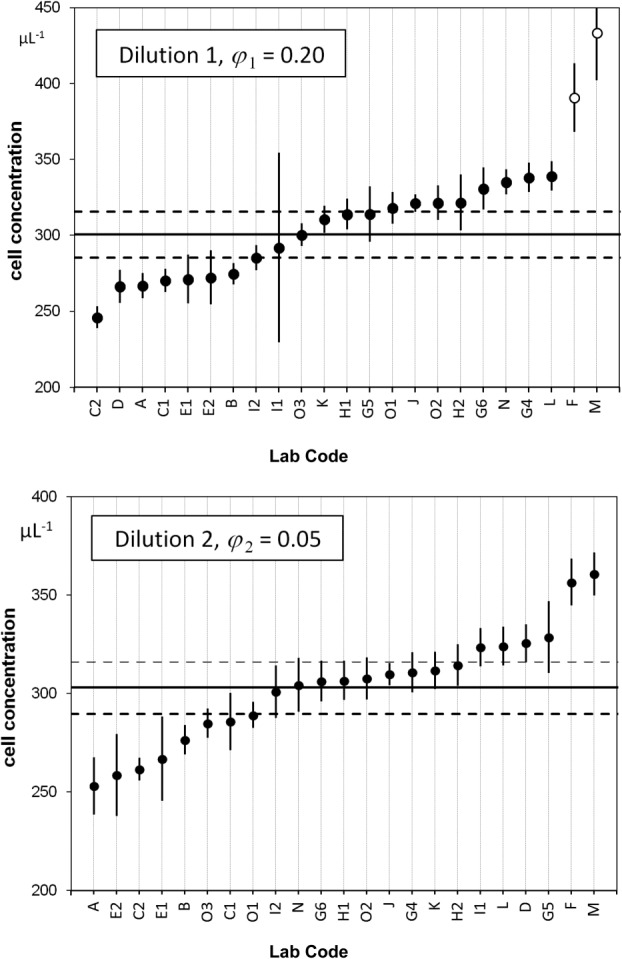
Figure 1.

Ranked concentration of CD4+ cells for dilutions 1 and 2. Concentrations of CD4+ sLL measured by the participants for dilution 1 (1:5, upper graph) and dilution 2 (1:20, lower graph). The straight lines represent the mean values and the dashed lines indicate the expanded uncertainties of the mean values corresponding to a level of confidence of 95%. For dilution 1, two outliers (open circles) were identified and not used when determining the mean value. Participant lab codes shown on the x-axis are ranked from lowest to highest mean CD4+ cell concentration for dilutions 1 and 2.
