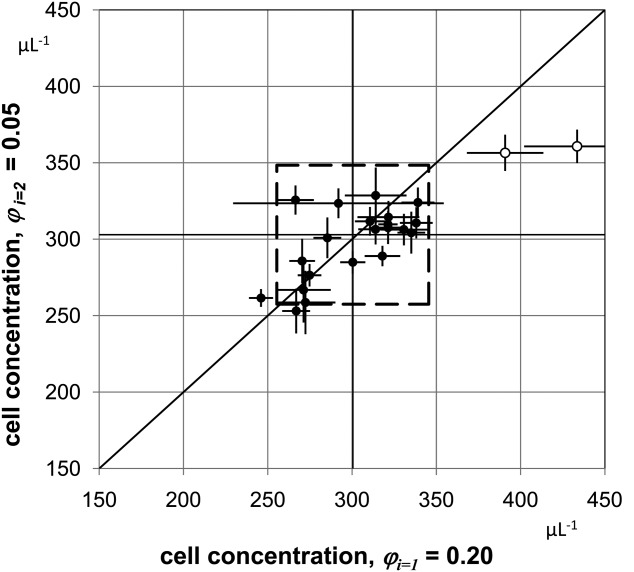
Figure 2.

Youden-diagram of CD4+ cell concentrations for dilutions 1 and 2. Youden-diagram of the results obtained for both dilutions. The two outliers are indicated by open circles. The mean values of participants = 300.4 μL−1 and
 = 302.9 μL−1 are plotted as vertical and horizontal lines, respectively. The diagonal with unity slope was inserted to illustrate that the results obtained from both dilutions are consistent with a linear relation within the uncertainties reached. The middle dashed square indicates boundaries corresponding to ±15% deviation from the respective mean values. If the outliers are disregarded, 2 out of 21 values are outside of this range, that is, 90% of the participants' results are within a limit of ±15%.
