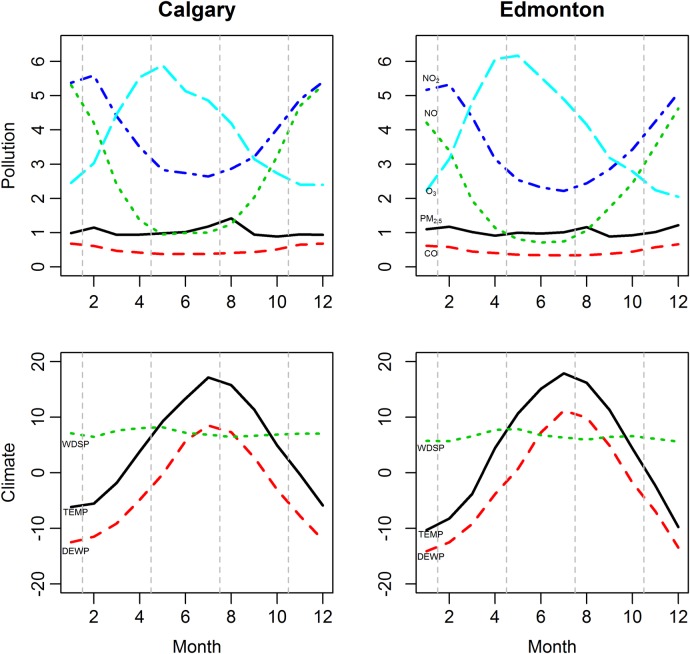
Figure 1.
Seasonal trends of monthly average concentrations of air pollutants and monthly levels of climate factors (April 1999–March 2010). Left (right) column represents Calgary (Edmonton); while the top (bottom) row represents pollution (climate) levels. Unit of the monthly average concentrations of pollutants was adjusted: CO (1 unit=1 mg/m3); NO (1 unit=10 µg/m3); NO2 (1 unit=10 µg/m3); O3 (1 unit=10 µg/m3); PM2.5, fine particulate matter (1 unit=10 µg/m3). Unit of the monthly average values of climate factors: TEMP, temperature (1 unit=1°C); DEWP, dew point temperature (1 unit=1°C); WDSP, wind speed (1 unit=0.1 knots).

