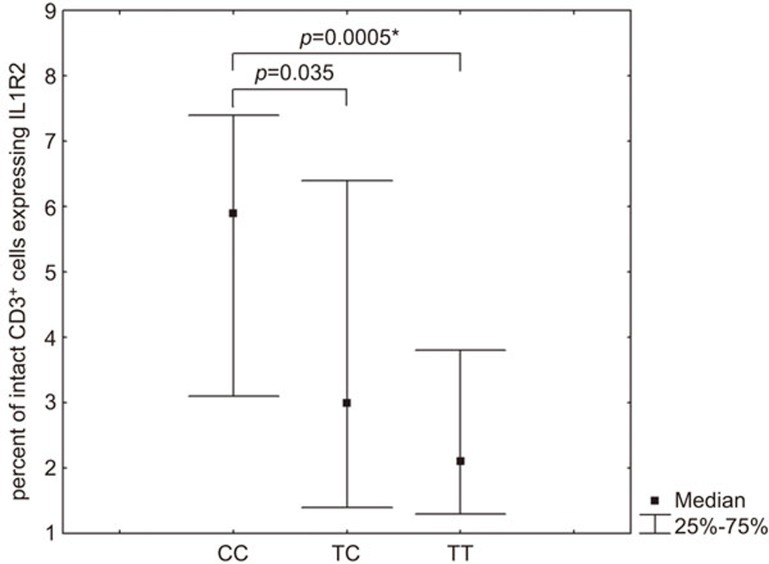
Figure 3.
Percentage of intact CD3+ cells expressing IL1R2 in carriers of different IL1R2 SNP rs4141134:T>C genotypes. The P-values indicated were calculated by the Mann–Whitney test. *Significant differences after performing Bonferroni corrections (CC vs. TT). IL1R, IL-1 receptor; SNP, single nucleotide polymorphism.

