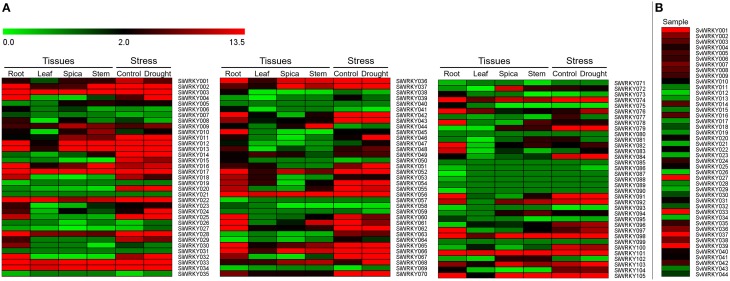
Figure 6.
Heatmap showing the expression pattern of (A) SiWRKY genes in four tissues, namely root, leaf, spica, stem, and dehydration stress library of Setaria italica, and (B) SvWRKY genes in pooled transcriptome of S. viridis samples across three developmental stages, namely seed germination, vegetative growth, and reproduction in different tissues including leaf, stem, node, crown, root, spikelet, floret, and seed tissues. The colored bar at top left represents relative expression value, where 0.0, 2.0, and 13.5 denotes low, medium, and high expression, respectively.

