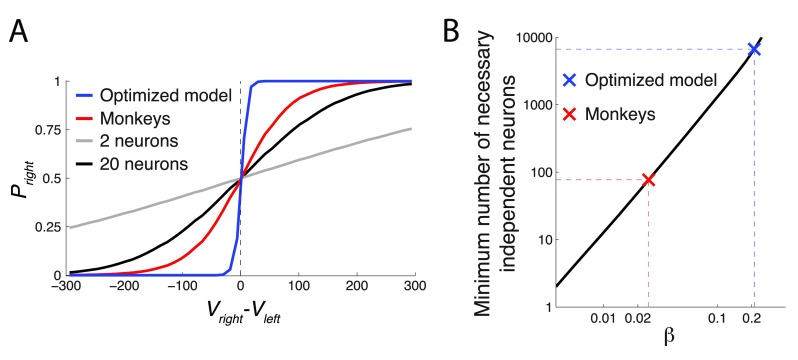
Figure 12. Increasing the steepness of the value comparison function costs an explosion in the number of required value-coding neurons.
( A) Same format as in Figure 10. The figure additionally includes responses of an ideal observer whose job is to tell V right and V left apart by reading out the responses of simulated spiking neurons (see text for details). The more independent neurons available to the ideal observer, the higher the ability to discriminate the two values. The gray (black) curve represent 2 (20) available neurons. ( B) The number of neurons necessary to obtain a value comparison function of a particular steepness ( β). The data are plotted in log-log space. In this space, the apparently linear relationship represents an exponential relationship between the two quantities. To increase β, one needs to access an exponentially higher number of independent value-coding neurons.

