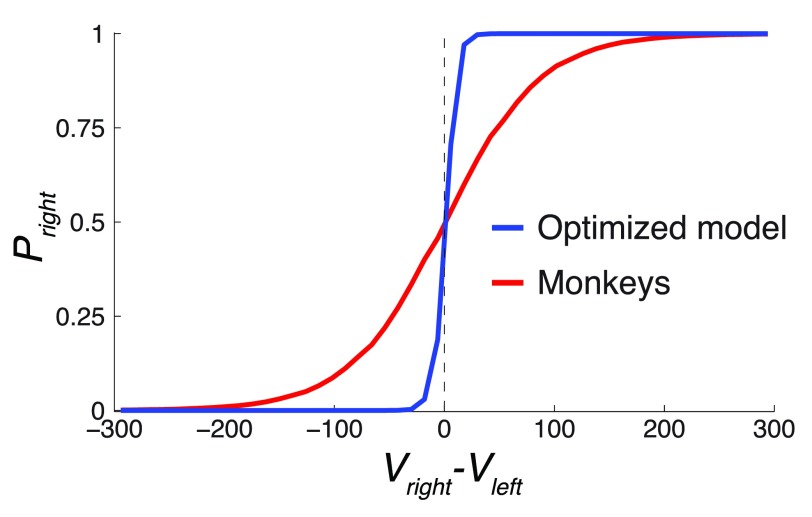
Figure 10. The value comparison function.
The figure plots P right = Ψ( V right– V left), over the range of ( V right– V left) (5th percentile equal to -172.8, 95th percentile equal to 176.3) for the Ψ parameter β of the monkeys and the optimized model. The optimized model had β about an order of magnitude higher than the monkeys, which defines its relatively sharp decision criterion.

