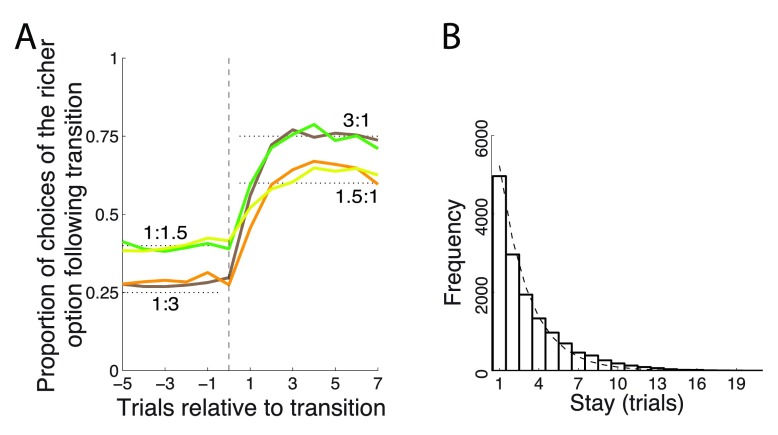
Figure 2. Matching behavior.
( A) Proportion of choices of an option as a function of each payoff ratio, aligned on a transition. The dotted black lines indicate the 3:1 and 1.5:1 proportions dictated by the matching law ( Equation 1). ( B) Frequency histogram of successive choices of one option. Dashed line: exponential fit.

