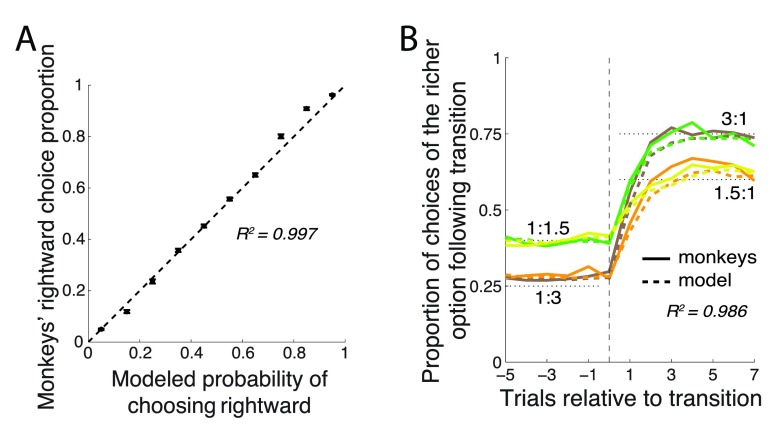
Figure 4. The model’s predictions.
( A) Proportion of choices of the rightward target (±SEM) as a function of the model’s probabilistic output, P right. ( B) Same format as in Figure 2A, with the model’s probabilistic output superimposed as dashed lines.

