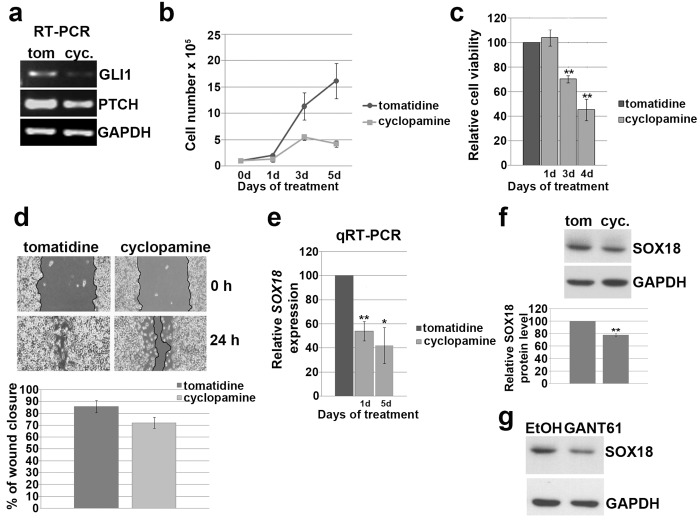
Fig 5. The effect of HH pathway inhibition on proliferation, viability, migration and SOX18 expression in HeLa cells.
a) The inhibitory effect of cyclopamine on GLI1 and PTCH expression. b) Proliferation curve of HeLa cells. Cells were treated with 10μM cyclopamine or tomatidine as a negative control, and counted after 1, 3 and 5 days of continuous treatment. Results were presented as the means ± SEM of at least three independent experiments. c) MTT viability assay performed after 1, 3 and 4 days of treatment with 10 μM cyclopamine or tomatidine. Relative cell viability was calculated as a percentage of HeLa cells viability after tomatidine treatment that was set as 100%. Results were presented as the means ± SEM of at least three independent experiments. P values were calculated using Student’s t-test, *p ≤ 0.05, **p ≤ 0.01.d) The effect of cyclopamine on cell’s migration, wound-scratch migration assay. Cells migration was quantified 24 h after scratching in constant presence of cyclopamine or tomatidine,by measuring the difference in gap closure where gap wide at 0 h was set as 100%. Results were presented as the means ± SEM of at least three independent experiments. e) Relative SOX18 expression after cyclopamine treatment detected by qRT-PCR. Relative SOX18 expression was presented as percentage of SOX18 expression in cells treated with tomatidine that was set as 100%. Results were presented as the means ± SEM of at least three independent experiments performed in triplicates. P values were calculated using Student’s t-test, *p ≤ 0.05, **p ≤ 0.01.f) The effect of cyclopamine on SOX18 protein level. Proteins were isolated after three independent treatments together with adequate controls, followed by Western blot. One representative blot was presented. α-tubuline was used as a loading control. The relative SOX18 protein level in HeLa cells upon treatment with cyclopamine was calculated as a percentage of SOX18 level in cells trated with tomatidine which was set as 100%. Data of three independent experiments are presented at histograms as the means ± SEM. Values of p≤0.01 are marked by **.g) The effect of GANT61 on SOX18 protein level. Proteins were isolated after three independent treatments together with adequate controls, followed by Western blot. One representative blot was presented. α-tubuline was used as a loading control.

