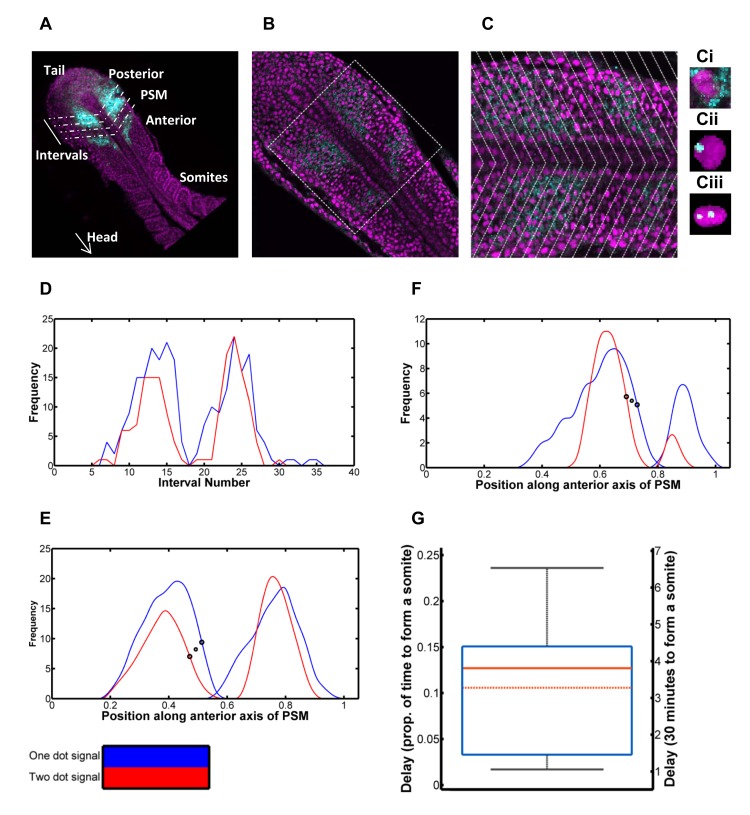
Fig 4. Quantification of delay in expression between her1 gene copies in a PSM cell.
4A: Schematic of quantification. Oscillatory gene expression in the posterior of the PSM is shown in cyan. The PSM is divided into intervals in order to quantify this gene expression, spatially. 4B: A single slice of a zebrafish embryo with nuclei in magenta and her1 mRNA in cyan. 4C: The zoomed in square of 4B to closer demonstrate the cytoplasmic her1 mRNA molecules and her1 transcripts in the course of synthesis. In both figures, the cyan stripes of her1 mRNA are apparent. Intervals are overlaid, based on the gradient of the her1 mRNA waves, and the frequency of nuclei with one her1 transcript in the course of synthesis and those with two is quantified per interval. 4Ci: A cell containing cytoplasmic her1 mRNA molecules. 4Cii: A cell with one her1 gene copy expressed. 4Ciii: A cell with two her1 gene copies expressed. 4D: Plot of frequency of nuclei with one dot (blue) and frequency with two dots (red) per interval. The two dot signal is delayed behind the one dot signal. 4E: The signals smoothed and the interval scale transformed to distance over the anterior axis (scaled from zero to one). The large black circles demonstrate the inflection points used to calculate the delay. This specific delay is selected as the increase in frequency of active her1 genes is a reflection of the repressing Her1/7 protein dissociating from the gene. The smaller symbol, between the two circles, gives the x coordinate used for further calculation in each case. 4F: Further example of smoothed dot count signals for an additional embryo. 4G: Box and whisker plot of delay between one and two dot signals, as a proportion of time to make one somite (left axis) and in minutes assuming the time to make one somite is thirty minutes (right axis). The minimum and maximum are given by the whiskers, the lower quartile and upper quartile by the box. The solid red line gives the median and the dot-dash red line gives the mean. The predicted delay in expression between the two her1 gene copies in a cell is three minutes. The mathematical model predicts cells will desynchronise in 6–8 oscillations when inserting the dissociation rate, min-1, corresponding to this delay.

