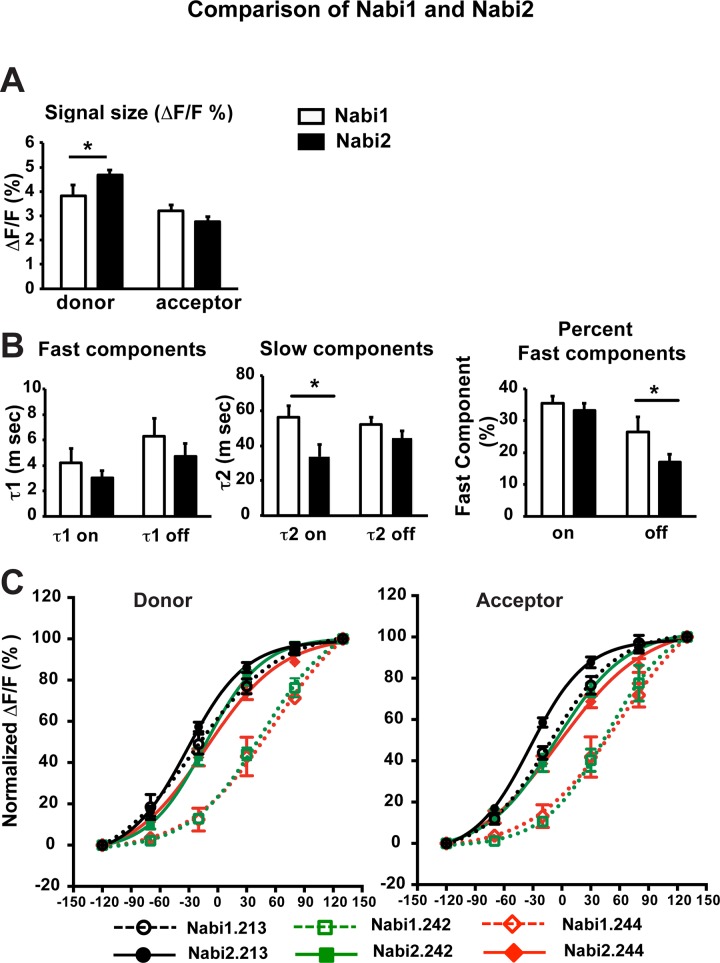
Fig 6. Comparison of Nabi1 and Nabi2 probes.
A-D. Signal size and time constants of eight Nabi1 and eight Nabi2 probes were averaged and compared by a t test. An asterisk (*) indicates statistical differences (p<0.05). A. ΔF/F of Nabi1 and Nabi2 probes for a 100 mV depolarization in HEK cells. The signals were taken from the averaged signals of Nabi1 or Nabi2 probes. Converting of Nabi1 to Nabi2 probes increased donor signal size, but not acceptor’s. B. Comparison of the time constants of the optical responses of donor to a 100 mV depolarization. Left: τ1 of signal activation and decay. Nabi1 and Nabi2 were not significantly different. Middle: Nabi2 had faster slow component of signal activation compared to Nabi1 (p = 0.03). Signal decay did not change significantly. Right: Replacement of FPs did not change significantly the percent fast component of signal activation, but reduced the percent fast component of signal decay in Nabi2 compared to Nabi1 (p = 0.03). C. Signal vs. voltage for three Nabi1 and Nabi2 probes. ΔF/F values were normalized to the maximum ΔF/F of each Nabi probe (N = 6–8 cells for Nabi1 probes, 14–19 cells for Nabi2 probes) and fit by a Boltzmann function. Left panel: donor signals vs voltage. Right panel: acceptor signals vs voltage. Dotted lines with open symbols are for Nabi1 probes and solid lines with closed symbols are for Nabi2 probes.

