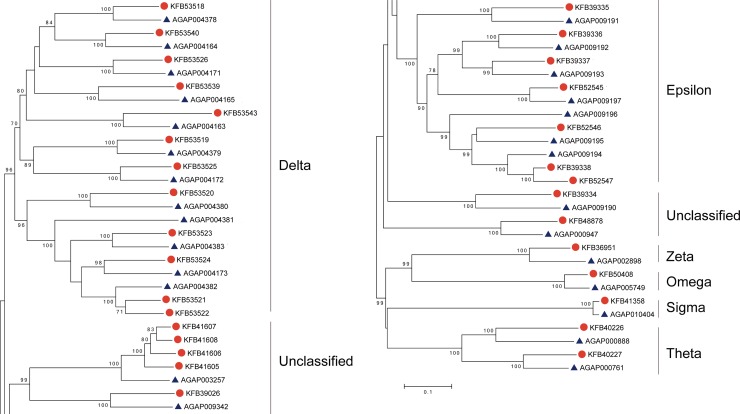
Fig 2. The phylogenetic analysis of glutathione-S-transferases.
Unrooted distance neighbor-joining tree showing the phylogeny of glutathione-S-transferases from the genomes of Anopheles sinensis (red circle) and Anopheles gambiae (blue triangle). The percentage of bootstrap confidence values greater than 70% (1000 replicates) is indicated at the nodes.

