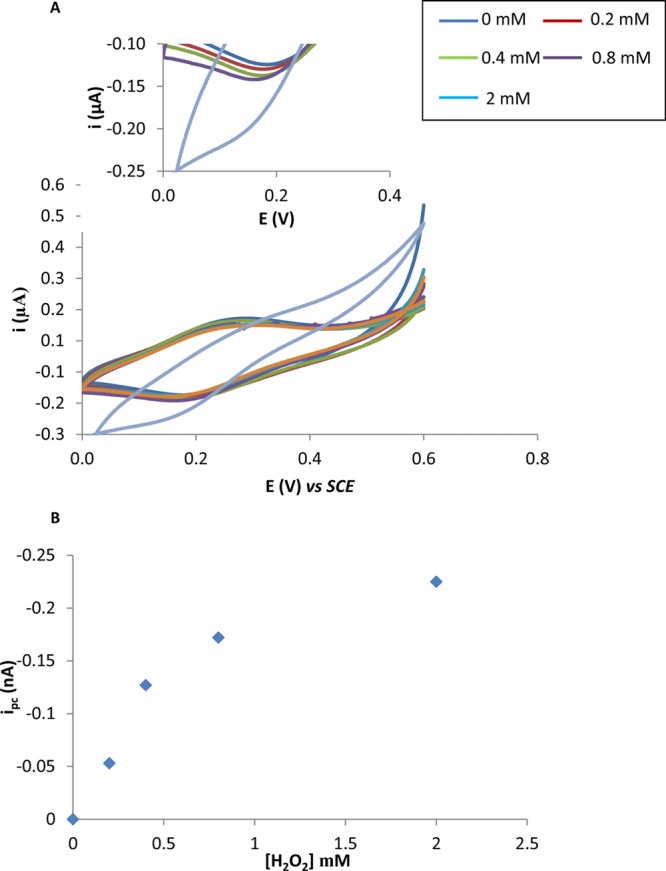
Figure 2.

(A) Cyclic voltammograms performed with PBS solution containing 0.2, 0.4, 0.8, and 2 mM of H2O2 at ITO-SWNT-Osbpy electrodes at a scan rate of 5 mV s–1. Insert is enlarged version of cathodic currents obtained. (B) Peak current versus concentration of H2O2.
