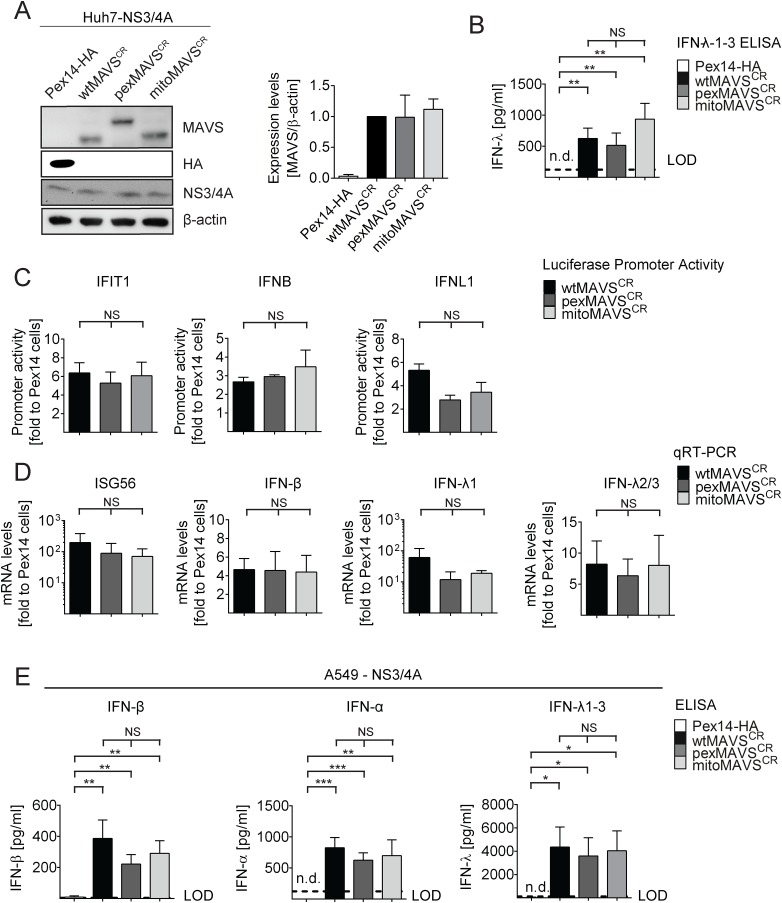
Fig 2. Comparable activation of the IFN system by MAVS proteins localizing to peroxisomes or mitochondria in Huh7 and A549 cells.
(A) Huh7-NS3/4A expressing cells were transduced with non-cleavable wt-, pex- or mitoMAVSCR or with Pex14-HA that served as control. Expression levels of MAVSCR variants were determined by Western blot. The quantification in the right panel displays MAVS abundance, normalized to β-actin, relative to wtMAVSCR expression levels (set to 1). Mean values from three independent experiments are shown. (B-D) Activation of the IFN response by overexpression of MAVS variants. (B) Huh7 cell culture supernatants were collected and IFN-λ1–3 protein levels were measured by ELISA. The dashed line indicates the limit of detection (LOD). N.d., not detectable. (C) For reporter-based analyses, firefly luciferase reporter plasmids were co-transfected with a SV40-based Renilla luciferase plasmid to normalize for transfection efficiency. Values for each reporter were normalized to those obtained for Pex14-HA transduced cells (set to 1). (D) Quantification of mRNA amounts of ISG56 and indicated IFNs as determined by qRT-PCR. Values were normalized to those obtained for Pex14-HA transduced cells (set to 1). All data were normalized to GAPDH using the ΔΔct method (E) A549 NS3/4A-expressing cells were transduced with lentiviruses containing non-cleavable wt-, pex- or mitoMAVSCR as well as Pex14-HA that served as control. Cells were stimulated by overexpressing MAVS variants, cell culture supernatants were collected and IFN protein levels were measured by ELISA. The dashed line indicates the limit of detection (LOD). N.d., not detectable. Data represent the mean from four independent experiments. Bars indicate the standard error. *, P≤0.05; **, P≤0.005; ***, P≤0.0005; NS, not significant. N.d., not detectable.

